Q3 2026: Scarcity Earnings
Record earnings pulled the forward P/E back toward its average, but much of this year's profit growth is scarcity rent from an oil shock and an AI chip shortage, and it is paid for partly by capex financed with debt. At the same time, the 10-year Treasury passed 5% and the Fed raised rates. Both halves of the valuation fraction are now at risk.
In Memory of Bradford Cornell
This is our first quarterly letter since my father and CCG strategic advisor Brad Cornell passed away in August, and it would not feel right to begin anywhere else. Brad’s professional work was remarkably expansive. After an interdisciplinary undergraduate degree in physics, psychology, and philosophy at Stanford, followed by a master’s in statistics and a PhD in financial economics, he became Professor of Finance at UCLA’s Anderson School, later taught at Caltech for nearly a decade, and wrote more than 150 papers and several authoritative books, including Corporate Valuation and The Equity Risk Premium. Alongside his academic career, he served as an expert and consultant in high-stakes corporate litigation, where his work contributed meaningfully to corporate law, and in the 1990s he advised the Czech Republic on its transition to a market economy. Brad had a sharp and endlessly curious mind that was never satisfied with an easy answer. He always made sure to break a problem down and work through it, by hand or with a spreadsheet, until he fully understood it, never taking things at face value. He brought real passion and joy to his work. He wanted to learn all he could and to use that knowledge to improve as many lives as possible. Personally, having the opportunity to learn from and work beside my father was one of the greatest gifts of my life. His influence runs through everything we do at Cornell Capital Group. I will share a fuller tribute in a future letter.
Key Points
- Records led by a few. The S&P 500 rose about 2% in Q3 and set a record in August, led by the Magnificent Seven, while the average stock and small caps fell.
- Scarcity, not breadth. Earnings are at records, and 2026 profits are expected to grow about 32%. Much of that growth comes from shortages, chiefly in AI chips and memory, which competition and new supply tend to wear down over time.
- Will the earnings last? Part of AI earnings is capex recycled among the same few firms, and much of that capex is paid for with debt. Final demand from end users has not yet been shown, and competition may pass much of the benefit to consumers.
- The hurdle rose. The 10-year Treasury passed 5% for the first time since 2007 and closed the quarter at 5.29%, its highest since 2002. The Fed raised rates, and the CAPE earnings yield fell below the real yield on a 10-year TIPS for the first time since that series began in 2003.
Q3 2026 Market Performance
The headline numbers were calm. The S&P 500 gained roughly 2.0% in the third quarter and set a record close of 7,798.99 on August 13. Its largest decline during the quarter was only about 3.4%, compared with 9.1% in the first quarter.
Beneath the index, gains were narrow. The Magnificent Seven returned about 11.5%, while the equal-weighted S&P 500 fell about 2%, small caps fell about 7%, and semiconductor stocks, measured by the VanEck Semiconductor ETF, fell about 7%. Microsoft rose about 38% and Meta about 29%. Memory, Q2’s standout, briefly sold off on fears of competition: on July 28 and 29, a large miss by SK Hynix and the Shanghai IPO of Chinese memory maker CXMT helped erase more than $1 trillion of chip-stock market value (CNBC). Micron finished the quarter lower but is still up more than 270% for the year.
The first quarter’s oil shock returned, larger: attacks in the Strait of Hormuz cut tanker traffic to about half its normal level (CNBC), and Brent crude rose from about $70 to a peak of $130.80 on September 15. Energy stocks returned about 16.5%, the best of any sector, while utilities and industrials were the worst.
Investors reacted far less than in March. The VIX peaked near 21, compared with 31 in Q1, and margin debt reached $1.45 trillion in August, up 37% from a year earlier (Advisor Perspectives/FINRA). The bond market and the Fed told a different story, which I return to below.
The Valuation Backdrop
On the usual cyclically adjusted measure, valuations are at record levels. The Shiller CAPE is about 41. The only higher reading in more than a century was at the 2000 peak (Robert Shiller’s data).
A different view will be common this quarter: that the market is no longer expensive. According to FactSet, the forward price-to-earnings ratio fell from 20.4x at the end of June to 19.0x at the end of September, just below its 10-year average of 19.1x. That headline multiple is a cap-weighted average. Goldman Sachs estimates that the equal-weighted S&P 500 trades at only about 15 times forward earnings, near its long-run norm, so the market’s valuation rests heavily on its largest companies (Goldman Sachs via Mike Zaccardi). The headline multiple fell even though prices rose: forward 12-month earnings estimates rose 9.3% while the index rose 2.0% (FactSet Earnings Insight, Oct. 2, 2026).
Reported results tell the same story. From the end of 2024 through June 2026, trailing 12-month reported earnings for the S&P 500 rose about 39%, while the index rose about 30% through September. Earnings more than accounted for the market’s gain, and the trailing multiple fell from about 28x to about 26x.
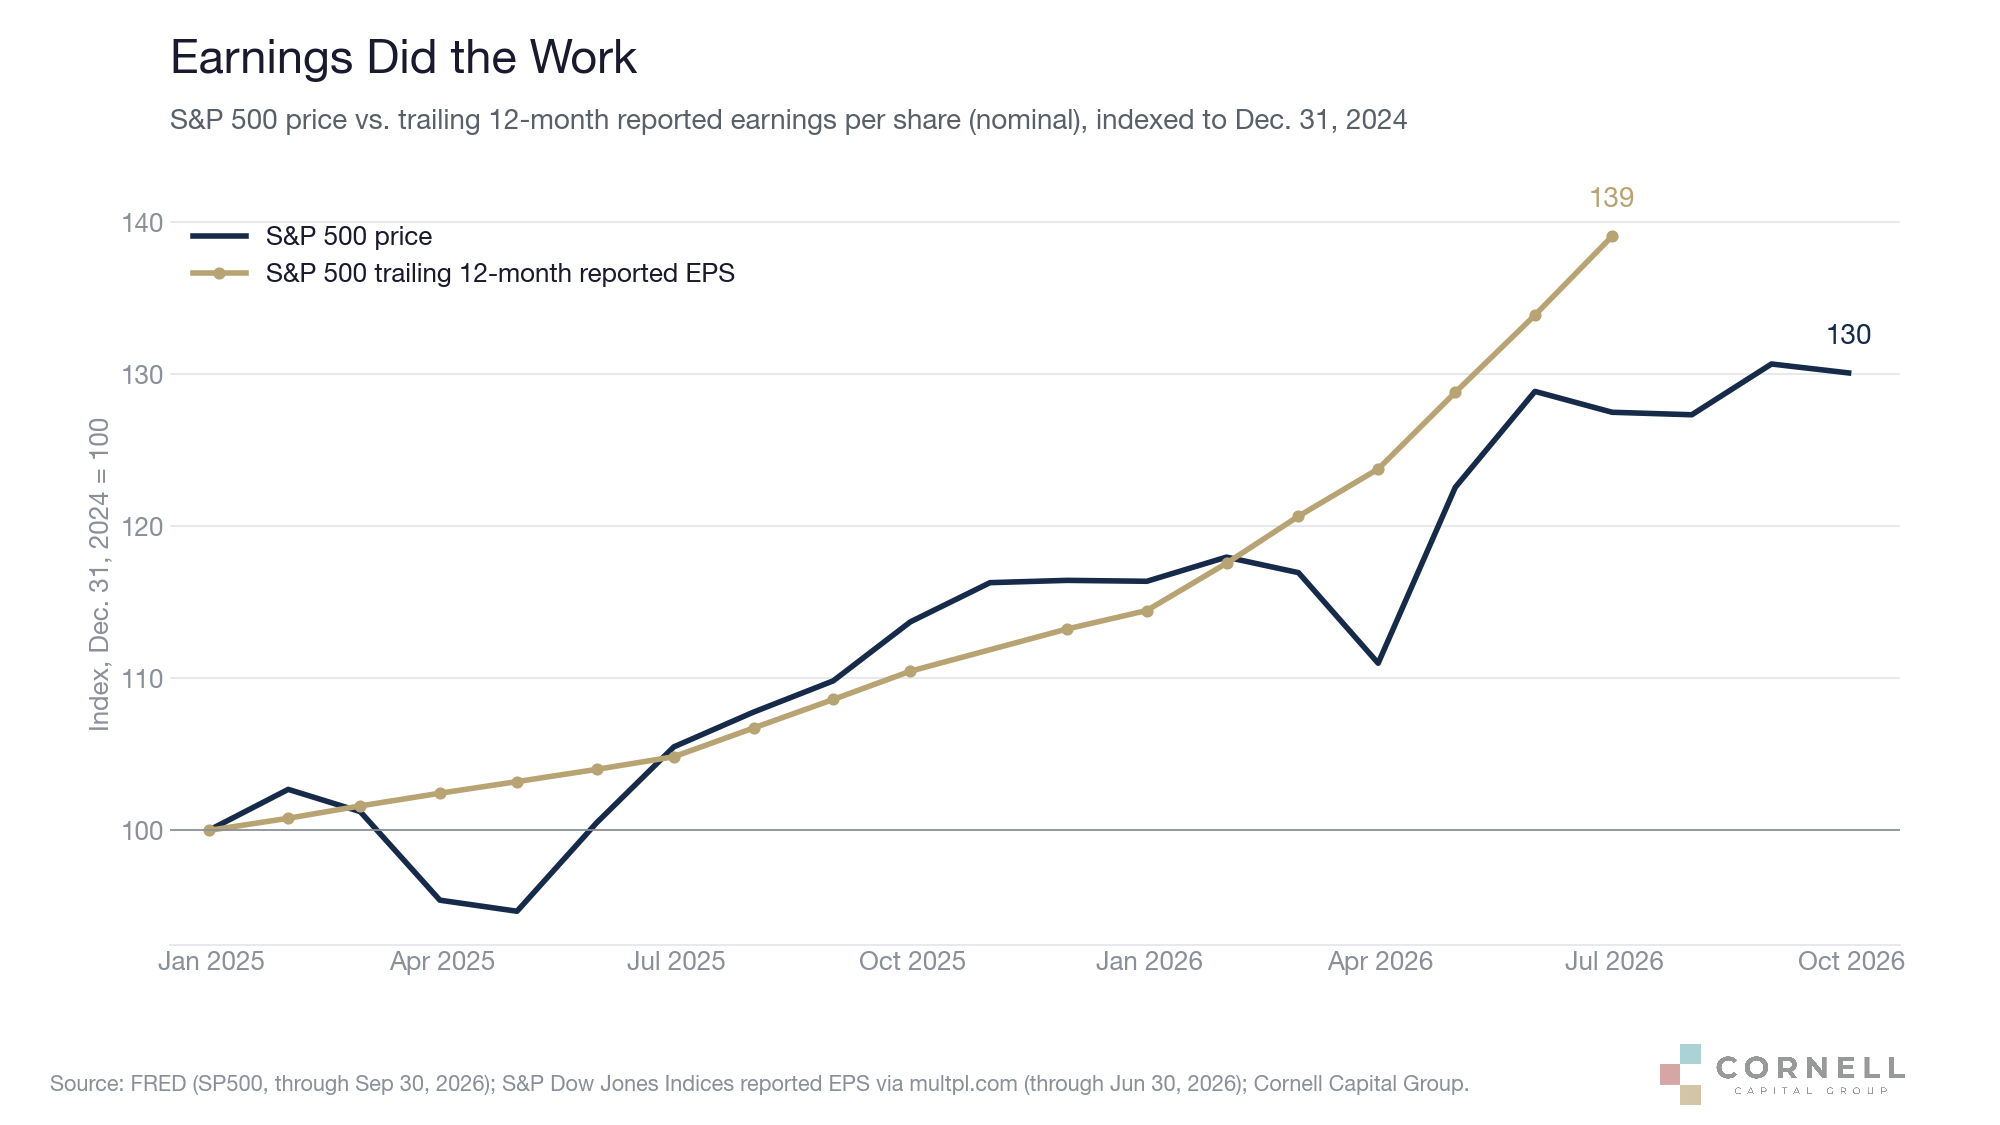
This is the key point for this quarter. If today’s earnings are not a reliable base, a 19x multiple on peak earnings is not cheap, and a market that rose because earnings rose is exposed if earnings fall. So the question is whether this year’s record earnings will last.
Scarcity Earnings
Earnings growth this year has been exceptional. Analysts expect S&P 500 earnings to grow about 29.5% in the third quarter and about 32% for calendar 2026, before slowing to about 16% in 2027 (FactSet Earnings Insight, Oct. 2, 2026). But the growth is highly concentrated. On FactSet’s estimates, chipmakers’ third-quarter earnings are expected to rise about 130% from a year earlier and energy earnings, lifted by the oil shock, about 114%. Technology outside the chipmakers is expected to grow about 24%.
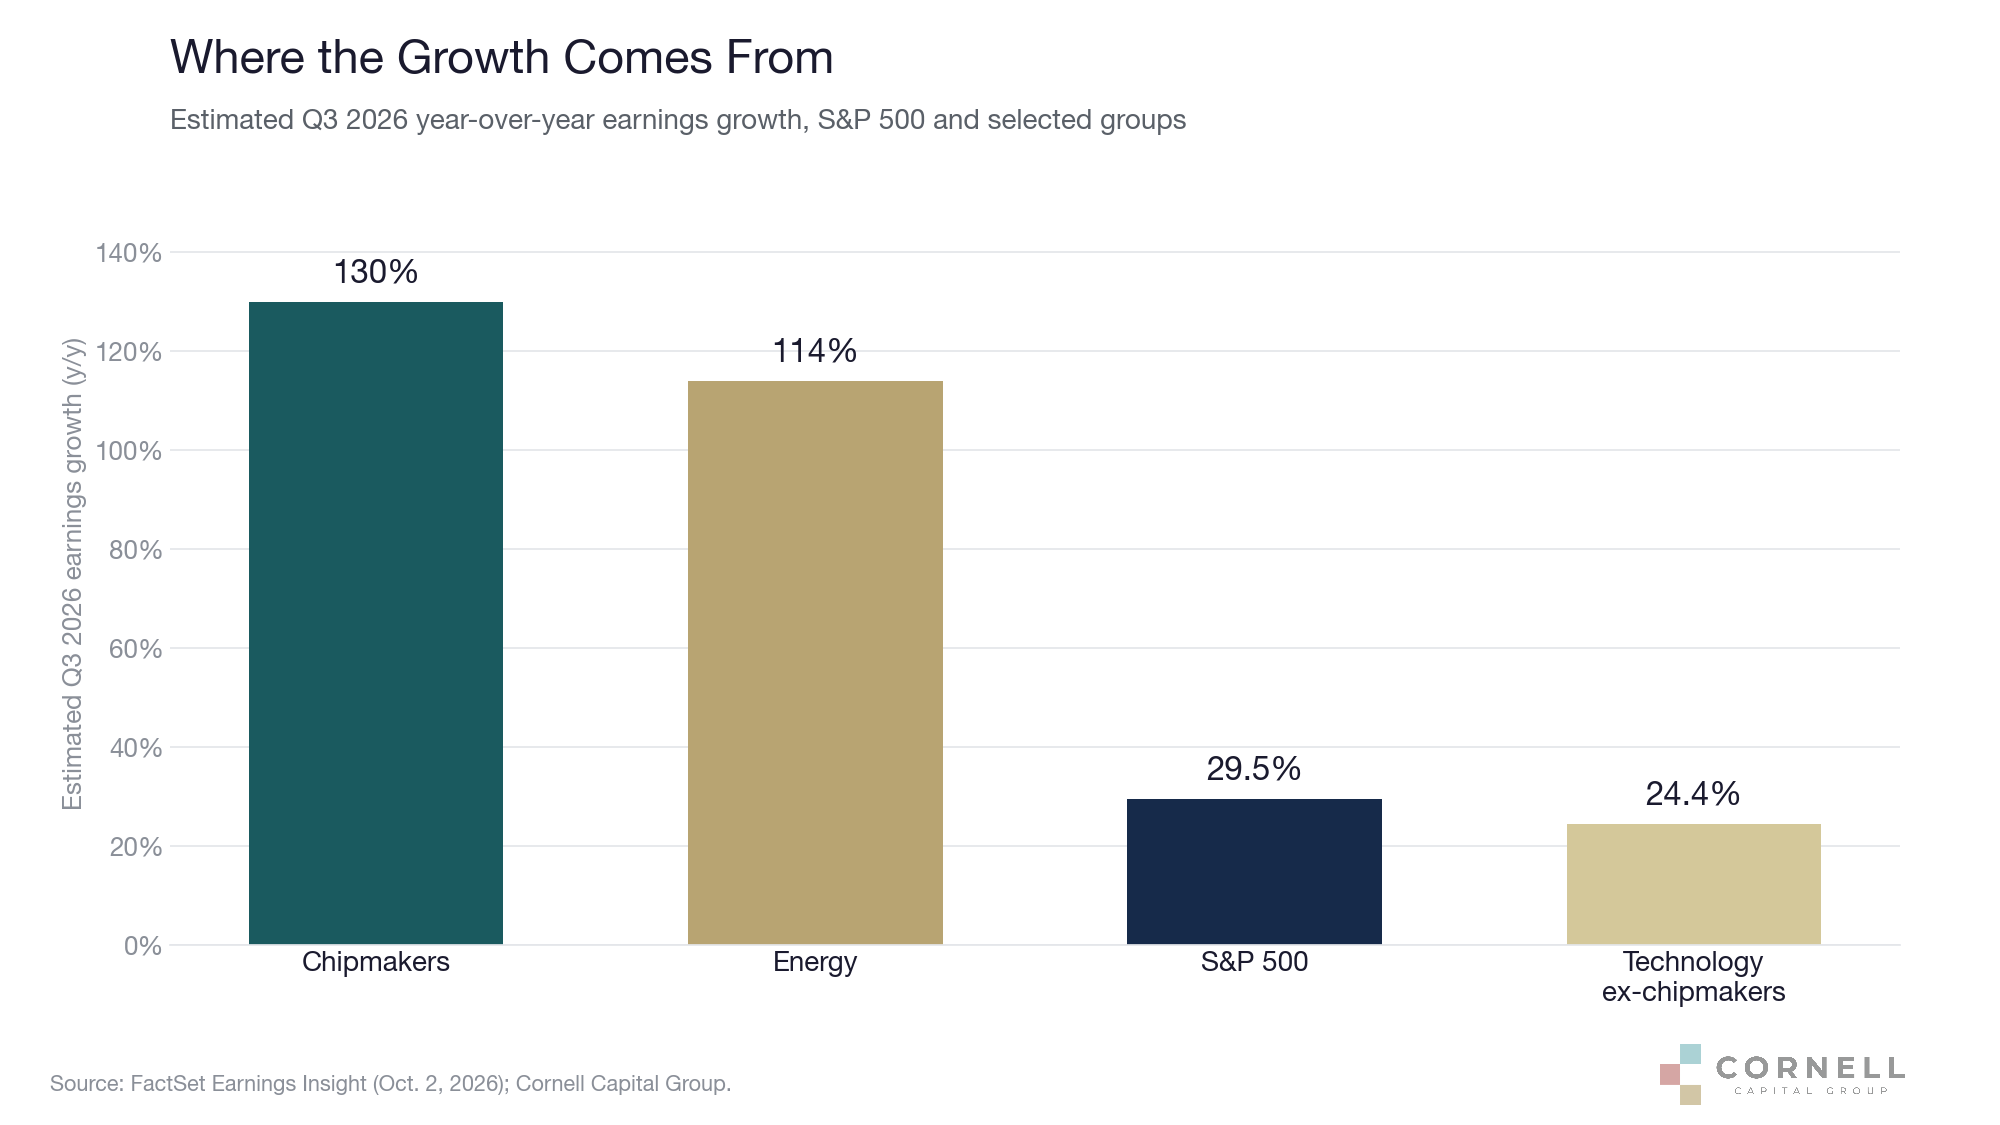
Both of the fastest-growing groups profit from a shortage. Economists call profits like these scarcity rents: returns earned because supply cannot yet meet demand, not because of a lasting competitive advantage, and they are exactly the profits that competition and new supply erode. A ceasefire can end an oil shortage. New factories end a chip shortage, and memory producers have never avoided that cycle; the late-July selloff was a brief preview.
Last quarter we argued that competition is removing the pricing power that the AI build-out assumes (see The Economics of Good Enough). This quarter I apply the same argument to current earnings, and I think it makes the future path of stock prices, especially where AI is concerned, more uncertain than at any point in this cycle. Three things decide whether this year’s record earnings last.
First, how much AI revenue reaches end users. A large share of AI profits today is capex passed between a few firms. The hyperscalers now expect about $725 billion of capital spending in 2026, up about 77% from 2025 (TMT Finance, CNBC). As we described last quarter, part of the demand is also circular: hyperscalers invest in the AI labs, the labs spend that money on hyperscaler computing, and the hyperscalers buy chips to supply it. This is self-sustaining only if it produces enough revenue from end users, the businesses and households paying for AI services, to earn a return on the equipment. Our Q2 estimate put the gap at about $1.75 trillion in annual revenue needed by 2030, compared with about $60 billion today at the two leading labs. Nothing this quarter narrowed that gap, and more of the spending is now paid for with debt. Earnings built on spending that has not yet earned a return from end users are not yet durable earnings.
Cash flow shows the transfer most clearly. On BofA Investment Research estimates charted by a16z Growth (via Hedgeye), 12-month forward free cash flow at four chipmakers (Nvidia, Micron, Broadcom and Applied Materials) has risen to about $420 billion, while at five hyperscalers (Amazon, Alphabet, Meta, Microsoft and Oracle) it has fallen from about $275 billion at its 2024 peak to roughly −$25 billion. My chart shows the same crossover in reported trailing cash flow: the hyperscalers’ fell from about $247 billion in early 2024 to about $126 billion in the second quarter of 2026, the latest quarter all nine companies have reported, while the chipmakers’ rose to about $198 billion. The chipmakers’ cash flow depends on the hyperscalers continuing to spend more than they generate, increasingly with borrowed money.
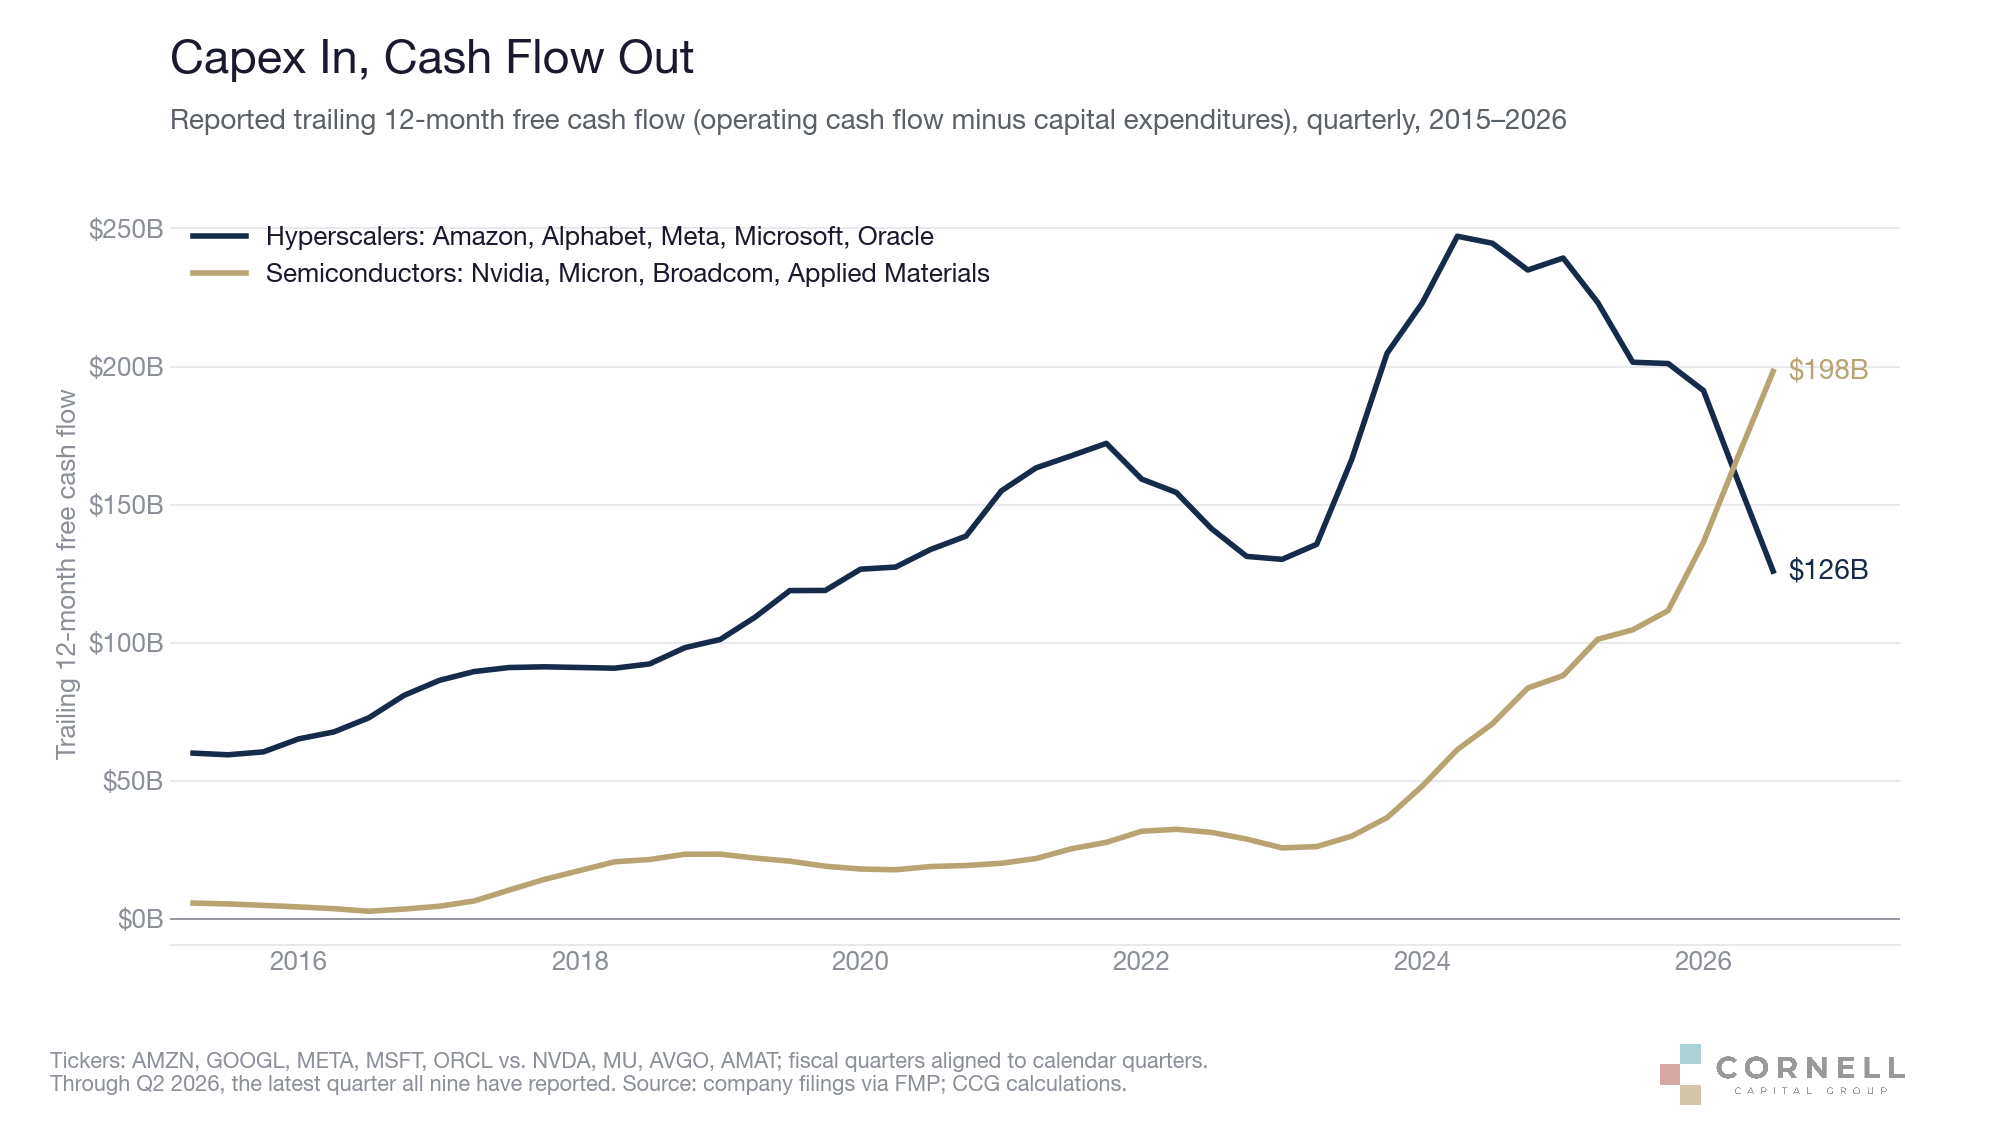
Second, whether competition erodes margins. When one part of a supply chain earns exceptional margins, customers look for substitutes and competitors add capacity. The hyperscalers design their own chips, Chinese memory producers such as CXMT are adding capacity, and open-weight models keep lowering the price of AI output, as we documented last quarter.
Third, whether the benefits go to shareholders or to consumers. This is the point of our earlier letters about cars, airlines and Buffett’s joke about Kitty Hawk. A technology can transform the economy while competition passes most of the gains to its users. If AI follows that path, the result for society may be very good. For investors, it would mean today’s supplier profits are closer to a cyclical peak than a permanent new level.
None of this requires AI to fail, and I am not predicting that it will. (I am a heavy user of AI and am continually astonished by its capabilities and productivity gains.) It requires only that this year’s exceptional profit growth is partly temporary, which is what normally happens to scarcity rents. Suppose half of this year’s roughly 32% earnings growth turns out to be temporary. Then the forward multiple on durable earnings is about 22x, not 19x, before any decline in the multiple itself (my calculation from the FactSet figures above, not a forecast).
There are serious counterarguments. The AI shortage may outlast past chip cycles: Nvidia guided to roughly $108 billion of revenue for the current quarter and expects about 70% revenue growth in fiscal 2028 (CNBC). And Microsoft and Meta, two of the quarter’s biggest winners, do not simply sell into a shortage. Demand could also keep outrunning supply for years if AI use spreads from training to everyday business and consumer applications, in which case earnings and margins could stay elevated far longer than in past chip cycles. My point is not that this cannot happen, but that the range of outcomes is wide and current prices lean toward the favorable end. Still, semiconductors fell about 7% this quarter at the first sign of new supply, and two shortages that could end with one ceasefire and one capacity cycle are a weak base for a valuation.
The Hurdle Rises: Interest Rates and Debt
The main theme concerns the numerator of the earnings yield, earnings. This quarter the discount rate moved too, and against equities.
From September 30, 2011 to September 30, 2026, the S&P 500 returned about 15.7% a year including dividends. By my calculation, about 8.5% a year came from growth in reported earnings, about 4.7% from a higher multiple and about 1.8% from dividends, which compound to that 15.7%. The trailing P/E roughly doubled, from about 13x, a low starting point during the euro crisis, to about 26x. Most of that rerating came by 2021, while the 10-year Treasury yield averaged about 2% and the 10-year TIPS yield about zero (S&P 500 price and total-return indexes via Yahoo Finance; S&P reported earnings via multpl; FRED). Our fourth-quarter 2025 letter argued that this support from low discount rates was largely exhausted, and this quarter it reversed. With the 10-year near 5.3%, future returns rest more heavily on earnings growth, which is exactly what I question above.
The 10-year Treasury yield closed above 5% in September for the first time since 2007 and reached 5.29% on September 30, its highest since 2002. The 30-year yield reached 5.64%, also its highest since 2002, and the 10-year TIPS real yield rose from 2.20% to 2.93%, its highest since 2008 (FRED and U.S. Treasury). The term premium, the extra yield investors demand for holding long-dated bonds, reached its highest level since 2010 (FRED data through September 25).
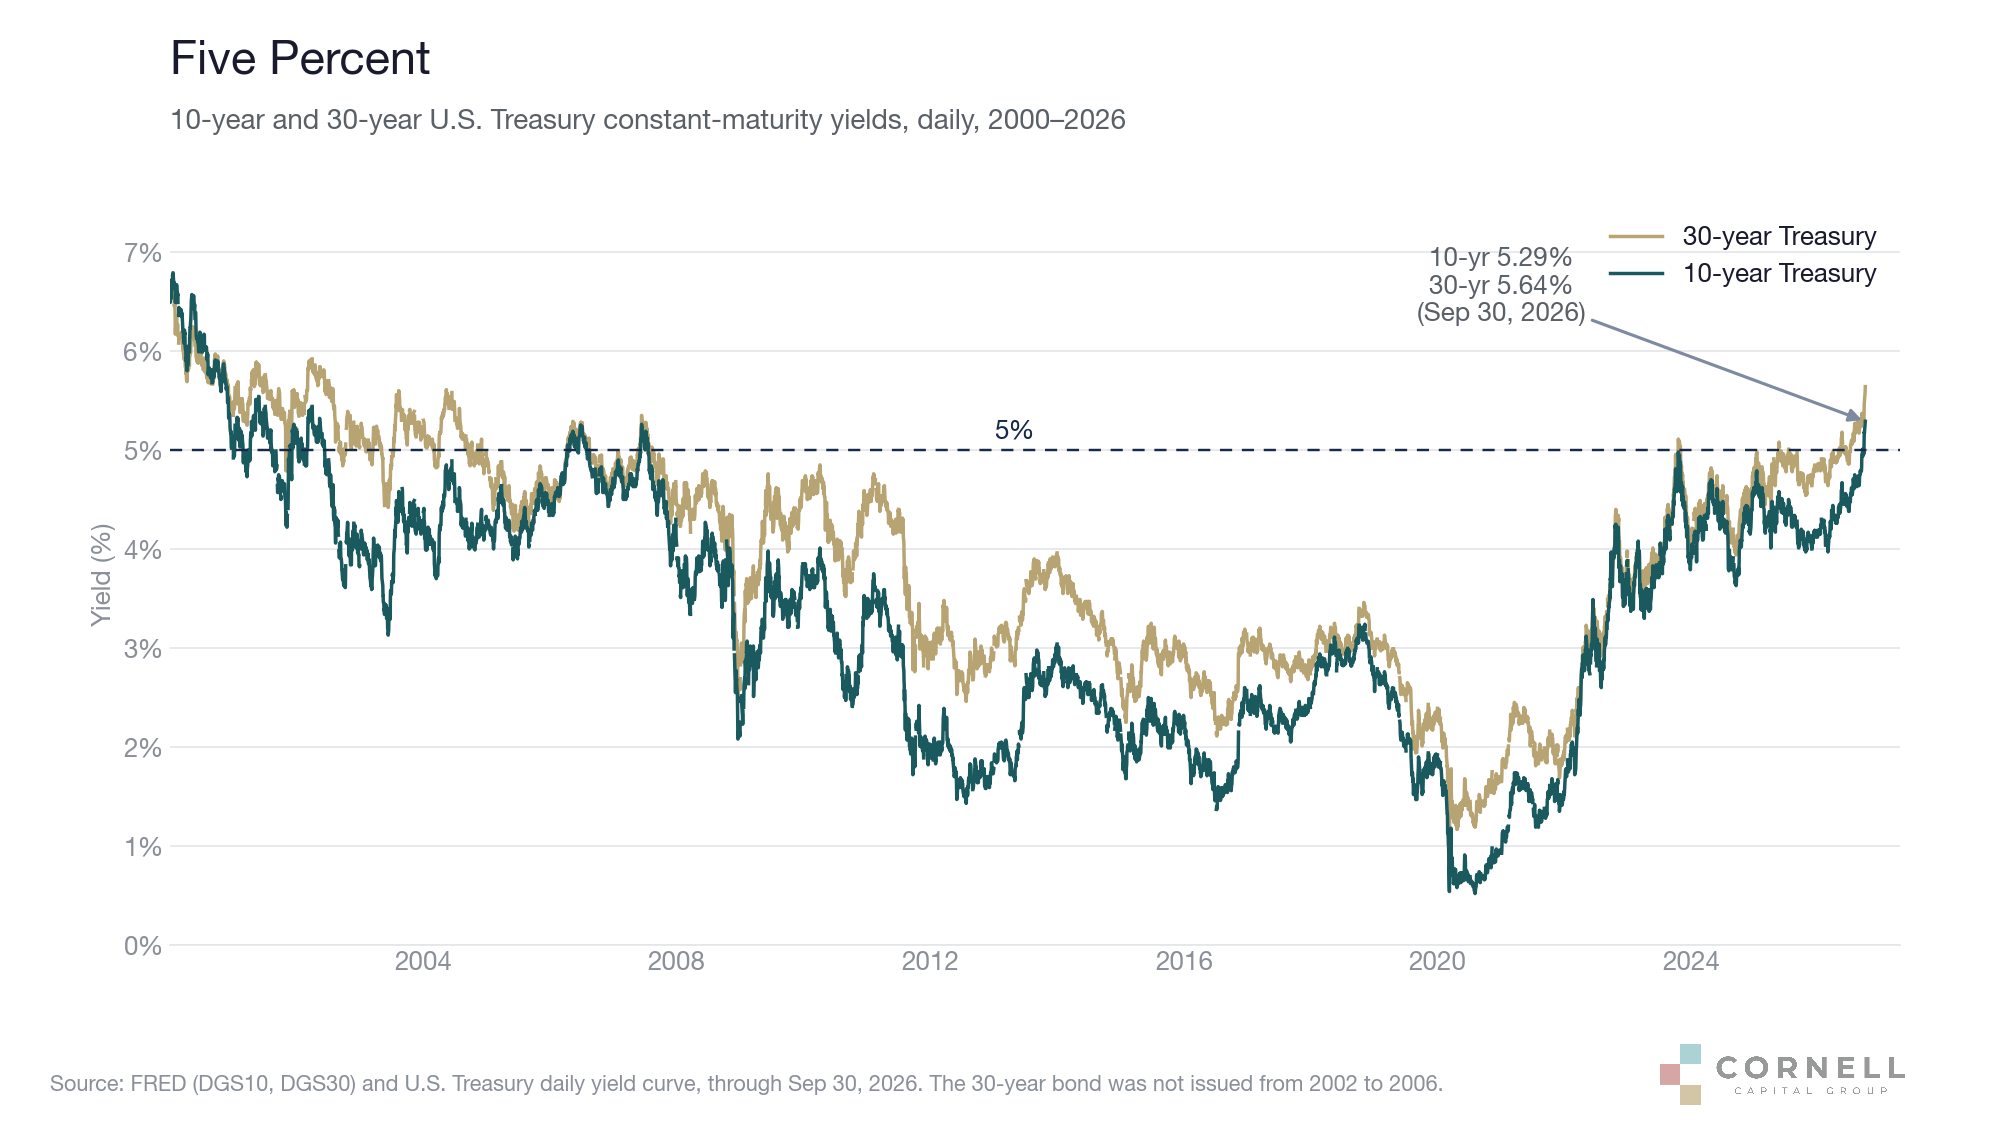
Policymakers responded in two ways. On August 19, the Treasury at least doubled the size of its long-bond buybacks (U.S. Treasury), and the relief lasted about a day (CNBC). As Howard Marks argued in his September 22 memo, buybacks address the symptom, higher long rates, and not the causes: persistent inflation, a lack of fiscal discipline, and competition for capital from the AI build-out. On September 16, the Federal Reserve raised its target range by 25 basis points to 3.75–4.00%, its first increase since 2023, stating that “inflation remains elevated” (Federal Reserve). Headline CPI inflation was 3.7% in August and headline PCE inflation 3.4% (FRED).
The result is unusual in valuation terms. Inverting the CAPE gives a cyclically adjusted earnings yield of about 2.4%. The 10-year TIPS pays about 2.93% in real terms, and its principal is backed by the U.S. government and adjusted for inflation, although its market price can fall before maturity if real yields rise. On a monthly basis, the CAPE earnings yield fell below the TIPS yield in September for the first time since FRED’s TIPS series began in 2003.
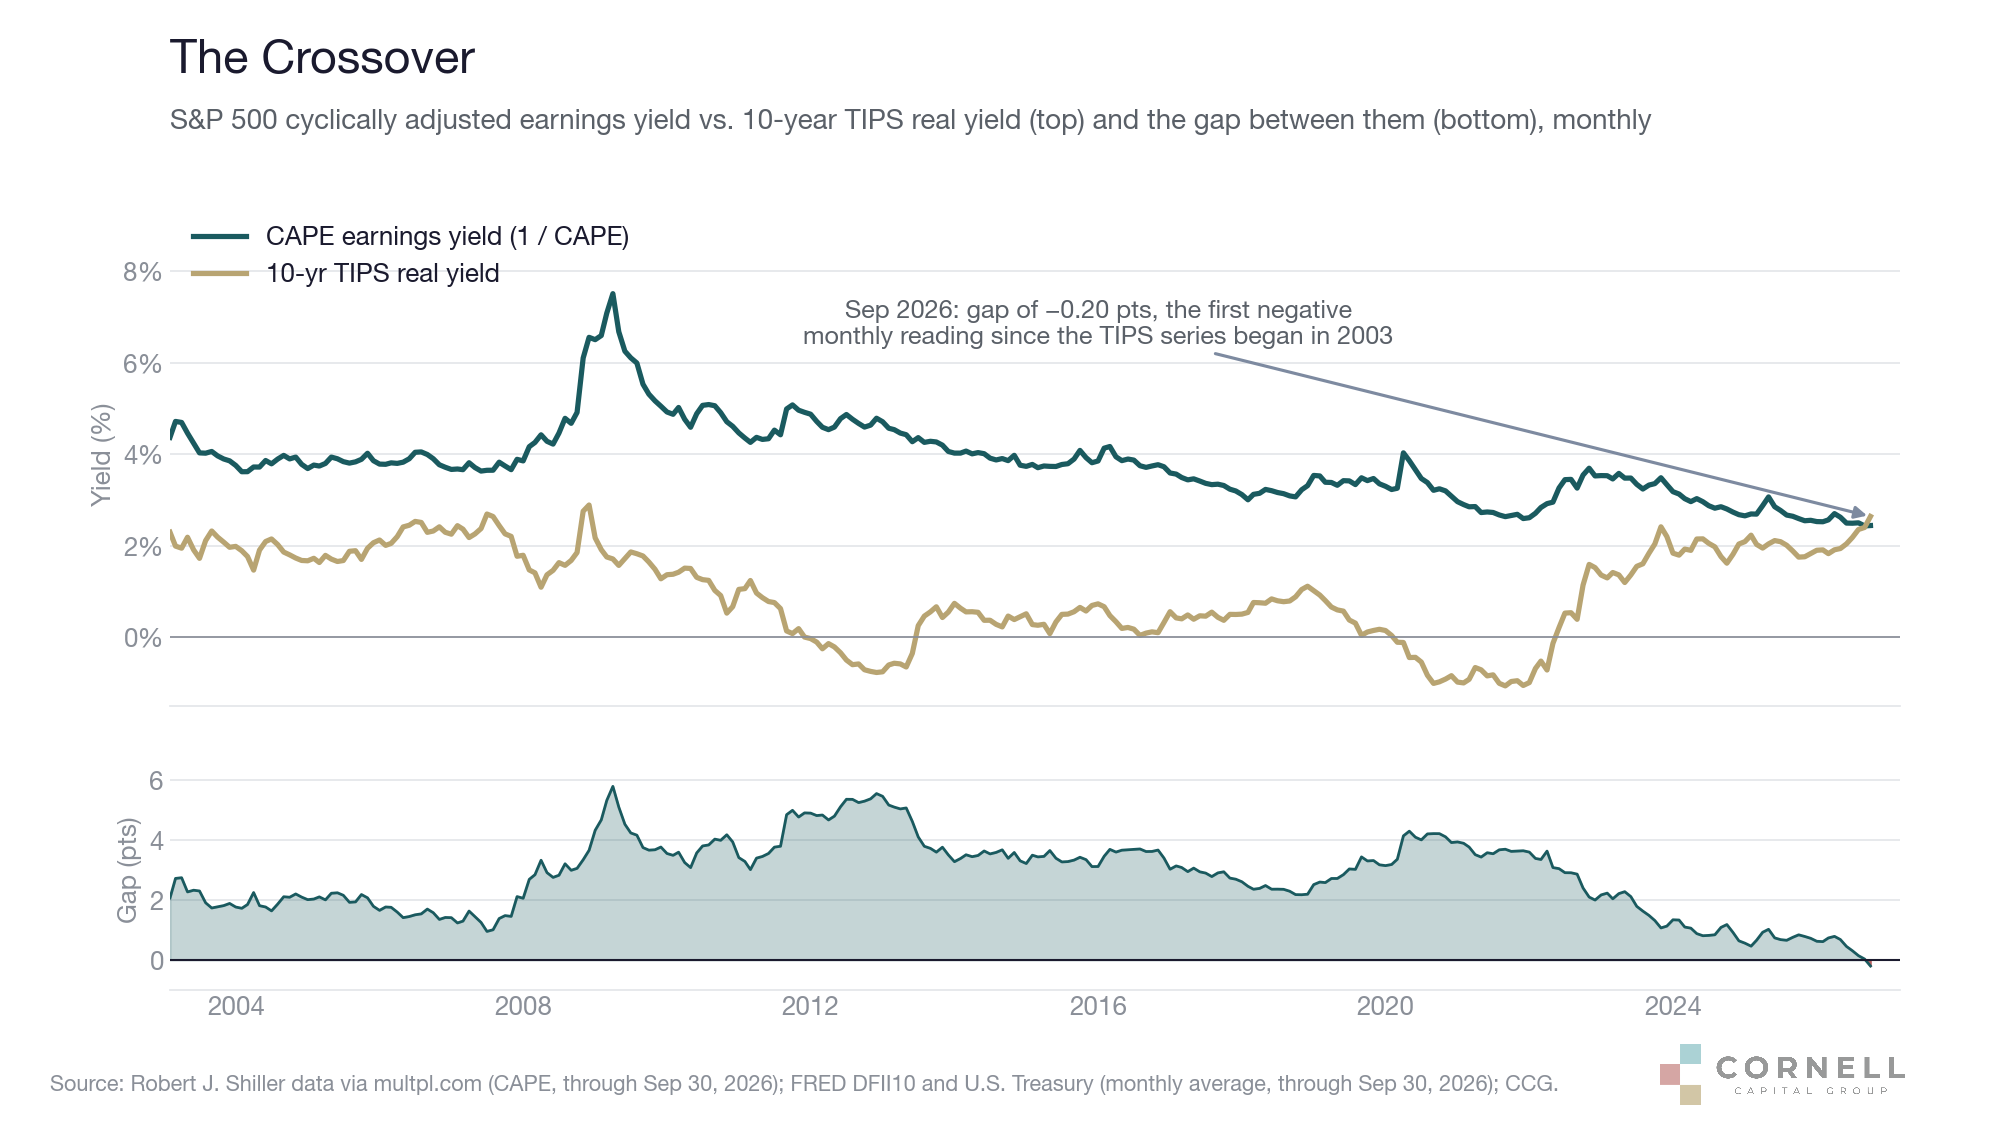
The standard objection, which Aswath Damodaran made in a September post, has some merit: the conditions that raise rates can also raise companies’ cash flows, and on forward estimates the earnings yield is about 5.3%, well above TIPS. But that answer depends on forward earnings, which are exactly what my main theme questions. The equity market is protected against higher rates mainly by the same scarcity earnings whose durability I doubt. If those earnings fade, investors face lower earnings and a higher discount rate at the same time.
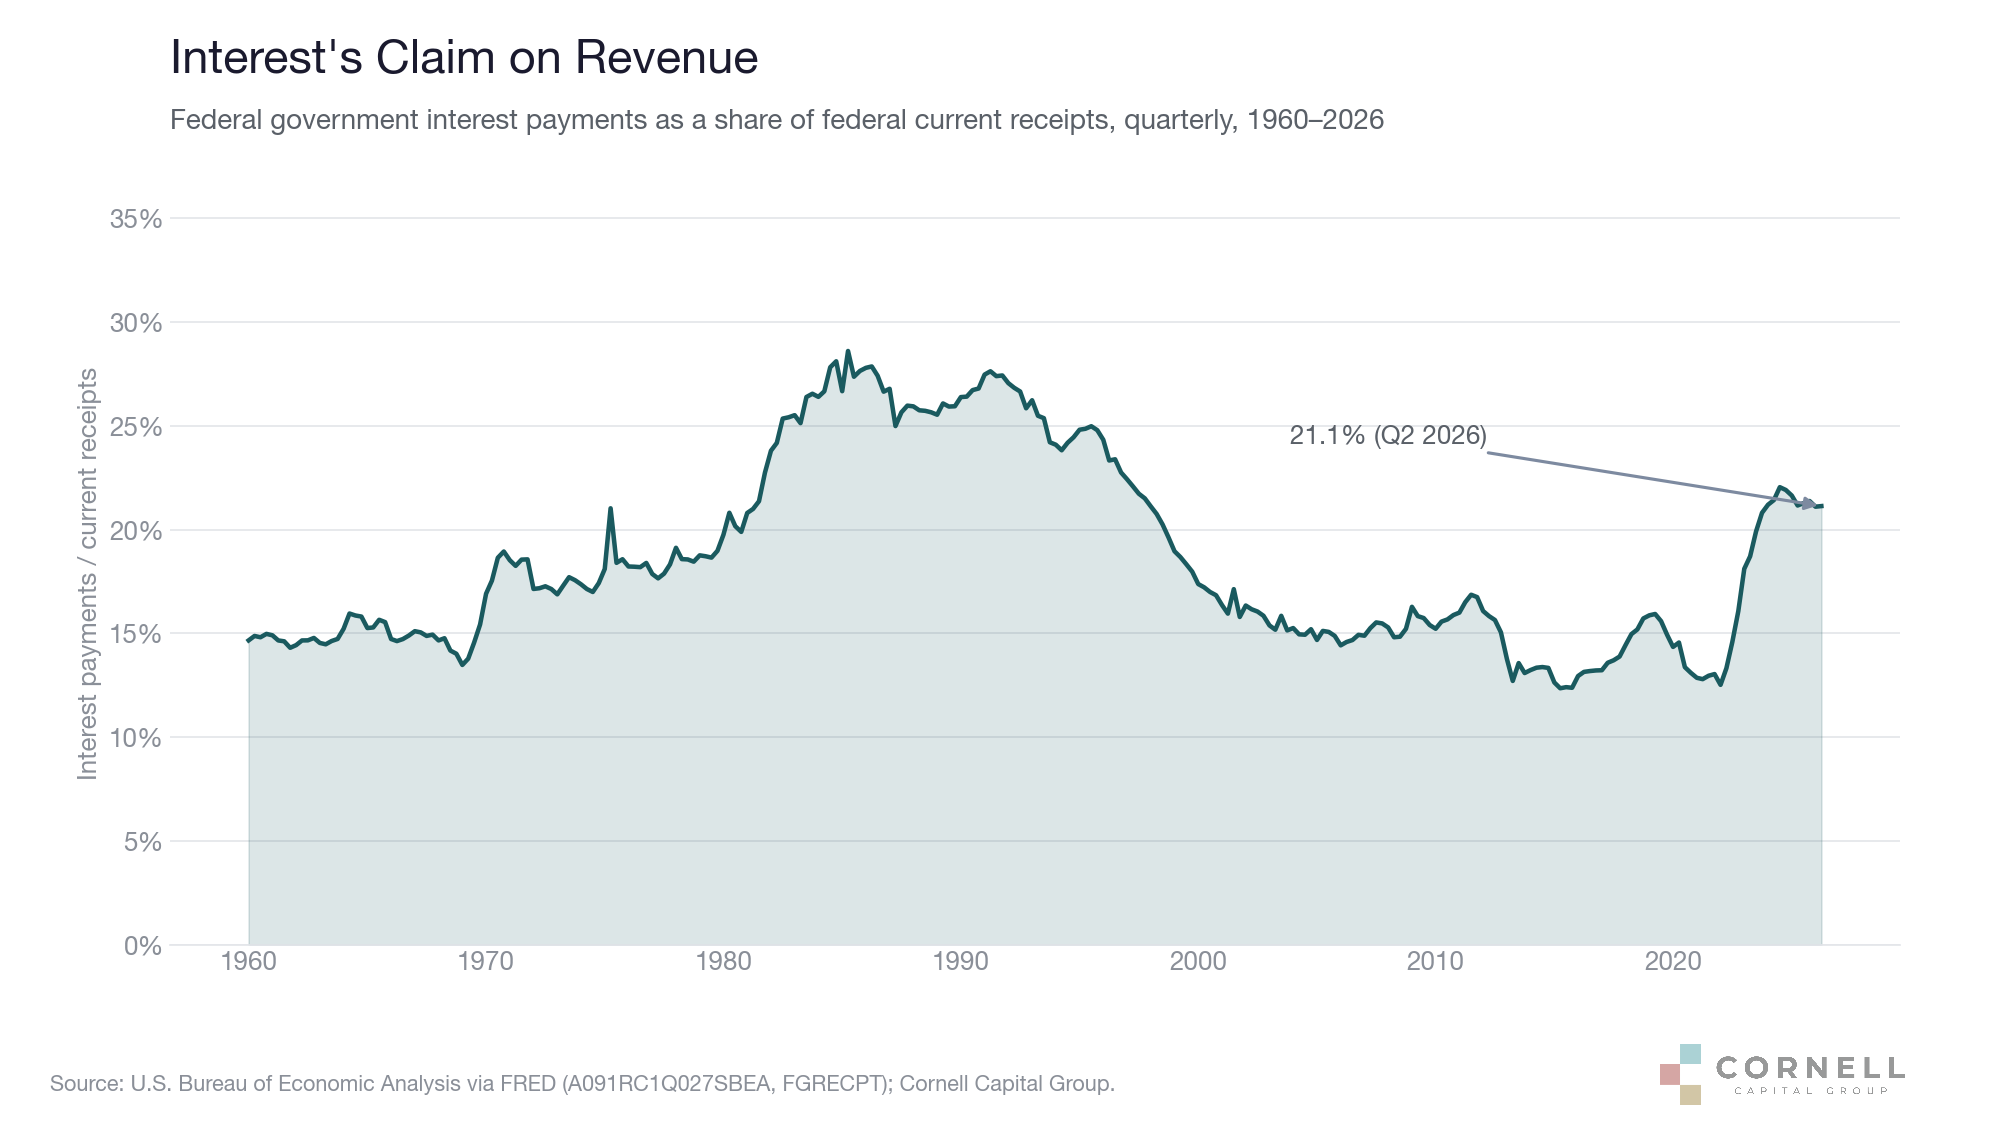
Debt is the other half of this story. The federal government’s interest payments have doubled since late 2021 to an annual rate of about $1.28 trillion in the second quarter, and roughly one dollar in five of federal revenue now goes to interest, a share last seen in the late 1990s (BEA via FRED). Deficits support corporate profits, but they also increase the supply of Treasury debt that investors must absorb, and that debt now rolls over at yields of 4–5%, not the near-zero rates of 2020 and 2021.
Corporate AI spending is now competing for the same capital. Hyperscaler bond issuance in the first half of 2026 was between $159 billion and $225 billion, depending on the definition (Fortune). Alphabet’s free cash flow was negative in the second quarter, and Meta’s capex used almost all of its operating cash flow. Capex paid for by debt, recorded as revenue at the chipmakers and depreciated slowly by the buyers, raises reported earnings today and leaves interest and depreciation costs for later. At 5% Treasury yields, those later costs are higher.
Structural Risks
The main risk is that earnings and discount rates disappoint together. Rising rates can be absorbed while earnings grow, and slowing earnings while rates fall. This quarter made both at once more likely. The Hormuz conflict could escalate or end suddenly, and either would reprice energy. Speculation is rising: margin debt is near record levels, SpaceX’s June listing raised $75 billion, the largest IPO ever (CNBC), and OpenAI and Anthropic have filed confidentially (Fortune). And a handful of AI-linked mega-caps, all betting on the same outcome, drove the quarter’s gains.
Investment Implications
None of this means investors should sell everything and hold cash. It does have practical implications, which build on our recent letters. These are general considerations, not recommendations for any individual investor.
Value the market on normal earnings, not peak earnings. A 19x forward multiple looks reasonable only if this year’s earnings are a durable base. Where earnings depend on a shortage, estimate what a business earns once the shortage ends, and value it on that.
Look for where earnings actually come from. Ask how much of a company’s revenue comes from end users and how much from other companies’ capex budgets, how much capex is paid for with debt, and whether depreciation reflects how quickly the equipment becomes obsolete.
Real yields now compete directly with equities. A 10-year TIPS yielding about 2.93% above inflation, backed by the U.S. government, pays more in real terms than the cyclically adjusted earnings yield on U.S. stocks. For investors who do not need full equity risk, matching part of future spending with inflation-protected bonds now costs little in expected return compared with recent years, although TIPS prices fall when real yields rise and the right mix depends on each investor’s circumstances.
Diversify away from what drove this year’s gains. The index’s growth rests on a few companies, two shortages and one investment theme. Broadening into cheaper markets outside the U.S., real-economy companies and a larger allocation to fixed income reduces reliance on any one of them.
Conclusion
I do not doubt that corporate earnings are at record levels. My question is what kind of earnings they are. Much of this year’s growth comes from shortages that competition and new supply tend to end, although sustained demand could delay that. Part of it is capex passed between a few firms and not yet matched by spending from end users. If history holds, competition may pass much of AI’s value to consumers. Meanwhile the risk-free rate has risen, and a TIPS now offers a higher real yield than the cyclically adjusted earnings yield on stocks.
So the future path of stock prices is more uncertain than the 19x forward multiple suggests. The multiple looks normal because the earnings under it are unusual. As always, I compare price with value. This quarter, both sides of that comparison moved against equity investors: earnings became less certain as the bond market raised the hurdle.