Medallion Fund The Ultimate Counterexample
In his book, The Man Who Solved the Market, Zuckerman (2019) describes how James Simon built his firm, Renaissance Technologies, and its premier fund, Medallion. For investment scholars and practition
MedallionFund.pdf (16045 downloads )
Abstract: The performance of Renaissance Technologies’ Medallion fund provides the ultimate counterexample to the hypothesis of market efficiency. Over the period from the start of trading in 1988 to 2018, $100 invested in Medallion would have grown to $398.7 million, representing a compound return of 63.3%. Returns of this magnitude over such an extended period far outstrip anything reported in the academic literature. Furthermore, during the entire 31-year period, Medallion never had a negative return despite the dot.com crash and the financial crisis. Despite this remarkable performance, the fund’s market beta and factor loadings were all negative, so that Medallion’s performance cannot be interpreted as a premium for risk bearing. To date, there is no adequate rational market explanation for this performance.
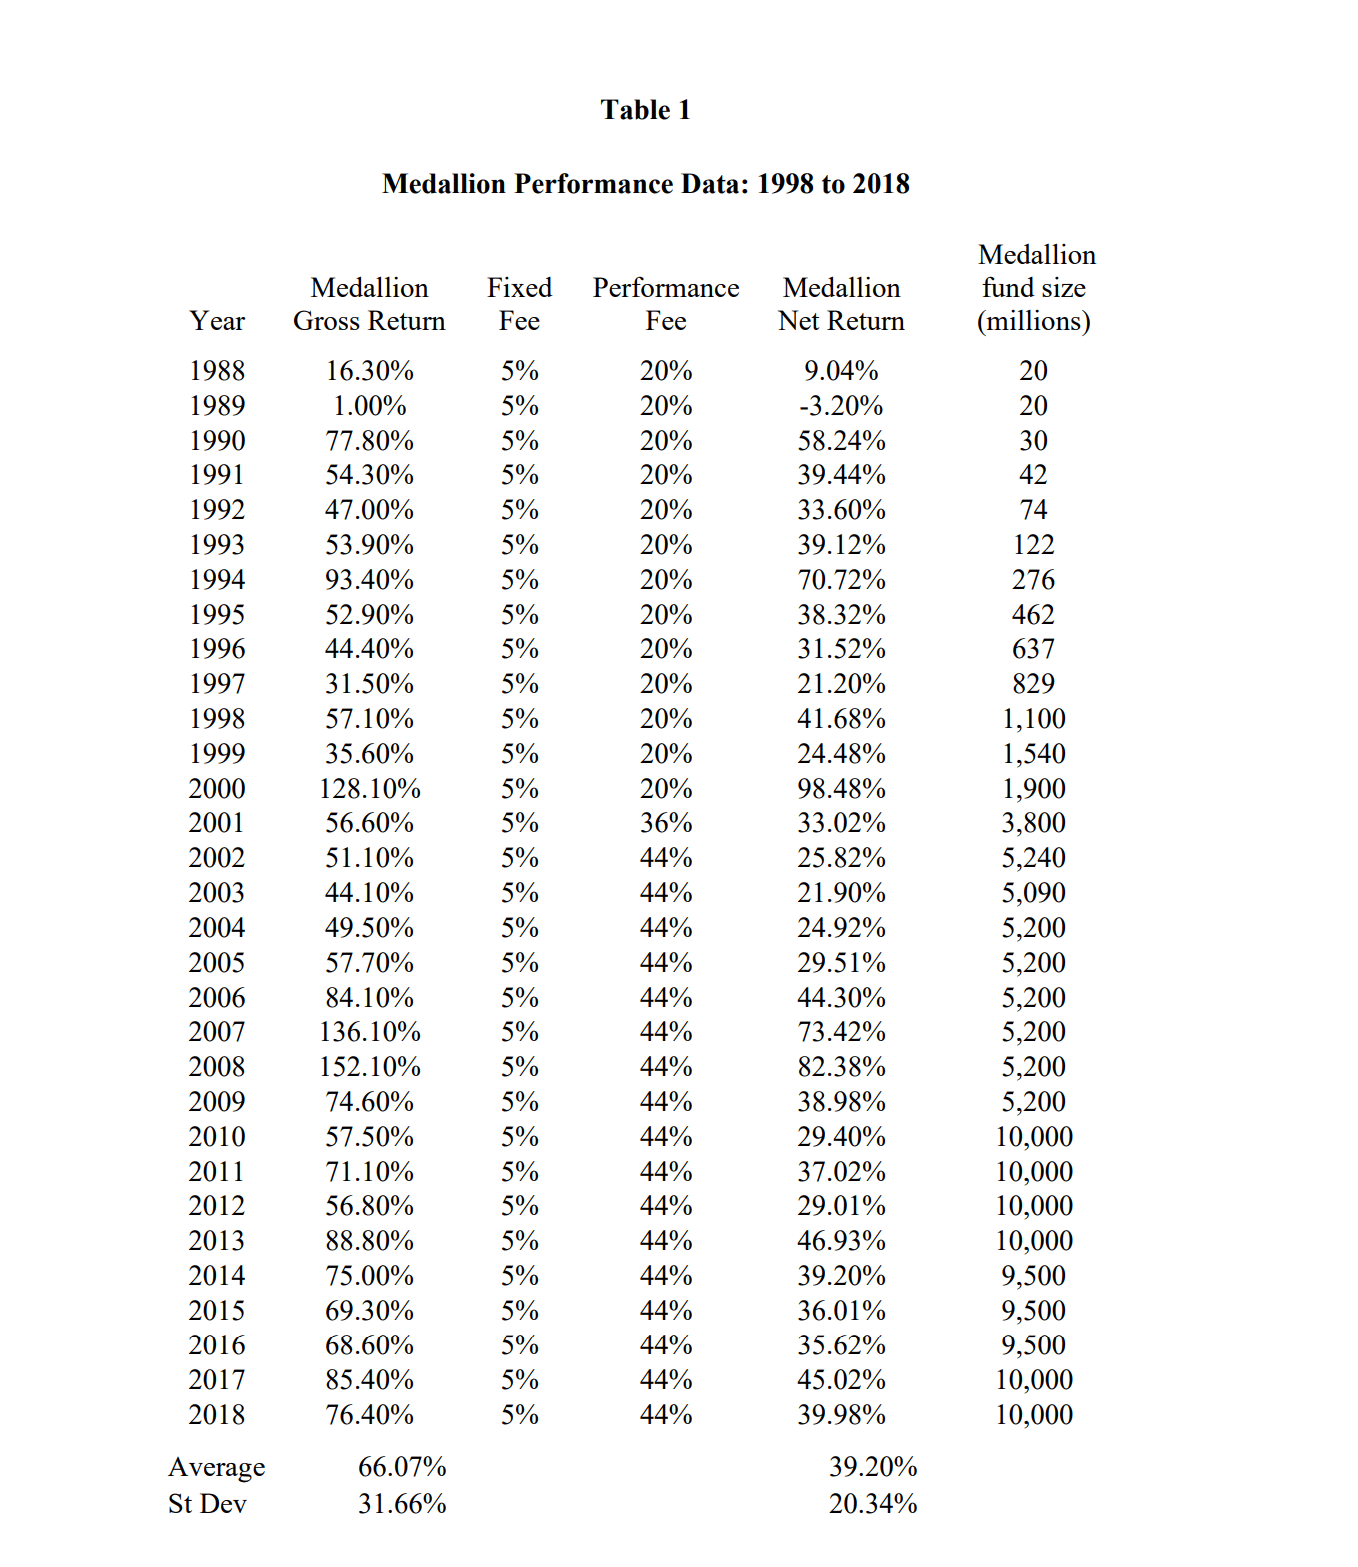
In his book, The Man Who Solved the Market, Zuckerman (2019) describes how James Simon built his firm, Renaissance Technologies, and its premier fund, Medallion. For investment scholars and practitioners, the most interesting part of the book is Appendix 1 where Zuckerman provides Medallion’s performance data. That data is reproduced as Table 1 here. To say that the performance is extraordinary is to understate by an order of magnitude.
In this short note, I work with the gross returns because they reflect the value added by investment management. The net returns, which are still extraordinary, are reduced by the fees that management can charge for its skill. Ironically, despite the industry leading fees charged by Medallion, Mr. Simons concluded that outside investors should not be allowed in the fund and accounts of the original outside investors were closed. Later Renaissance did start new funds in which outsiders could invest. More on that below.
Turning to time series of gross returns, the results are unprecedented. In forty plus years of reading hundreds of papers on investment anomalies, including some that benefited from data snooping and ex-post selection bias, I have never seen any performance approaching that reported by Medallion. Over the course of the 31 years from 1988 through 2018, the fund never had a negative return. During the dot.com crash and the financial crisis Medallion’s returns were 56.6% and 74.6%, respectively. Following the first two years of operation, the lowest annual return was 31.5%
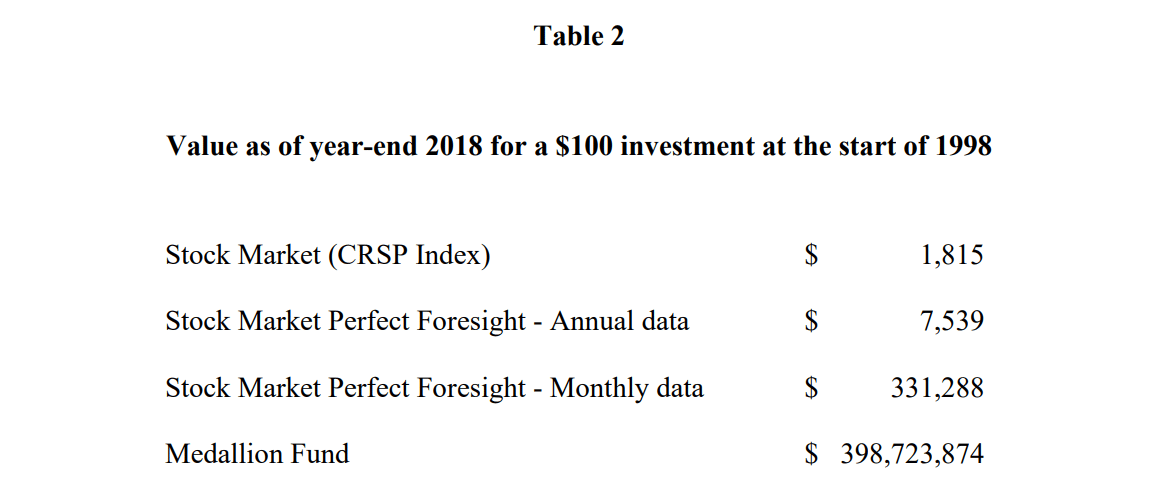
The most dramatic way to appreciate Medallion’s extraordinary performance is to calculate the growth of wealth. As shown in Table 2, $100 invested in the CRSP value weighted market at the start of 1988 would have grown to $1,910 by the end 2018 (assuming all proceeds are reinvested). That reflects a respectable compound return of 9.98%,
particularly considering that both the dot.com crash and the financial crisis occurred during the sample period. In comparison, $100 invested in Medallion at the start of 1988 would have grown to $398,723,873. It takes a while for the to sink in. In 31 years, Medallion would have turned a $100 investment into a $400 million fortune. For a further comparison, I calculated “perfect foresight” returns using both monthly and annual data for the CRSP index. The perfect foresight returns are the returns that would be earned by investing in the market whenever the subsequent return exceeded that on Treasury bills and buying Treasury bills when it did not. Using annual perfect foresight returns, the ending POW for the market jumps to $7,539 illustrating the benefits of foresight. Using monthly returns, it grows to a remarkable $331,288. As large as this is, it still less than 10% of the ending wealth produced by the same $100 investment in Medallion.
In fairness, the Medallion estimate in Table 2 overstate growth that could be achieved in the aggregate because there were times when the fund was not accepting new investments so that employees could not reinvest and other times when employees chose to withdraw their winnings. Had that not been the case, the series of returns implies that the original seed money would have grown to many trillions of dollars. Long before that, the size of funds under management would have limited returns. Nonetheless, it is interesting to note that as the fund grew from $20 million to $10 billion, as shown in Table 1, the returns did not fall off. Apparently, the strategy was sufficiently robust that it could be scaled to $10 billion without affecting the returns.
As described by Zuckerman, Medallion’s strategy involved constantly opening and covering thousands of short-term positions, both long and short. According to Robert Mercer, one of Medallion’s key investment managers, Medallion was right on only about 50.75% of its trades. Nonetheless, he stated that taken over millions of trades that percentage allowed the firm to make billions. It is worth noting that engaging in millions of trades suggests that the transaction costs would be significant. The fact that the reported gross returns are after trading costs, makes Medallion’s performance even more extraordinary. It also implies that Renaissance was apparently particularly effective in minimizing such costs.
Returns of the level reported by Medallion could hardly be interpreted as risk premiums. In fact, it is difficult to speak of risk regarding Medallion because the fund never experienced a negative annual return. The fund did have a large standard deviation of returns, 31.7%, but that was around an arithmetic mean of 66.1%, implying a Sharpe ratio of exceeding 2.0. As to systematic risk, a regression of Medallion’s excess returns on the CRSP market index produces a beta of approximately -1.0 so that in addition to its extraordinary performance Medallion also offered a hedge against market risk. A three-factor regression adding the Fama and French (1996) variables SMB and HML reveals that loadings on both factors are also negative, though neither is statistically significant. Whatever the source of Medallion’s returns, it is not a reward for risk bearing.
Although Medallion is closed, Renaissance Technologies does have funds that are open to outside investors. The two primary ones are Renaissance Institutional Equities Fund and Renaissance Institutional Diversified Alpha. According to Zuckerman, however, neither follows the same strategy as Medallion. This is consistent with the fact that the returns on the funds have been relatively mundane and in no way comparable to Medallion. It suggests that there is a scale limit on whatever strategies have generated Medallion’s returns.
Unfortunately, this paper cannot offer a convincing explanation for Medallion’s performance. One possibility is that Medallion is simply a better market maker than any of its competitors and that over millions of trades that advantage translates into the observed returns. But the returns are so large, it stretches that explanation to the limit. Whatever the source of the performance, Medallion is a Michelson-Morley level challenge to the hypothesis of market efficiency. On that basis alone, it is worth further consideration.
References
Fama, Eugene and Kenneth R. French, 1996, Multifactor explanations of asset pricing anomalies, Journal of Finance, 51, 55-84.
Zuckerman, Gregory, 2019, The Who Solved the Market, Penguin Random House, New York, NY