The Continuing Market Melt-up The third quarter sustained the upward momentum in the market, which…
Investor Memo Q3 2024: Walking the Tightrope
Stock Price Performance in Review
We begin our Q3 2024 memo with a look back over the last ten years. The chart below plots both the standard S&P 500 index, which is value-weighted, and the equal weighted S&P 500 index over the last decade. The major difference between the two indexes is that large companies in general, and the Mag 7 in particular, have a much smaller impact on the equal weighted index. The chart shows that up through the beginning of 2019 the two indexes moved closely together.
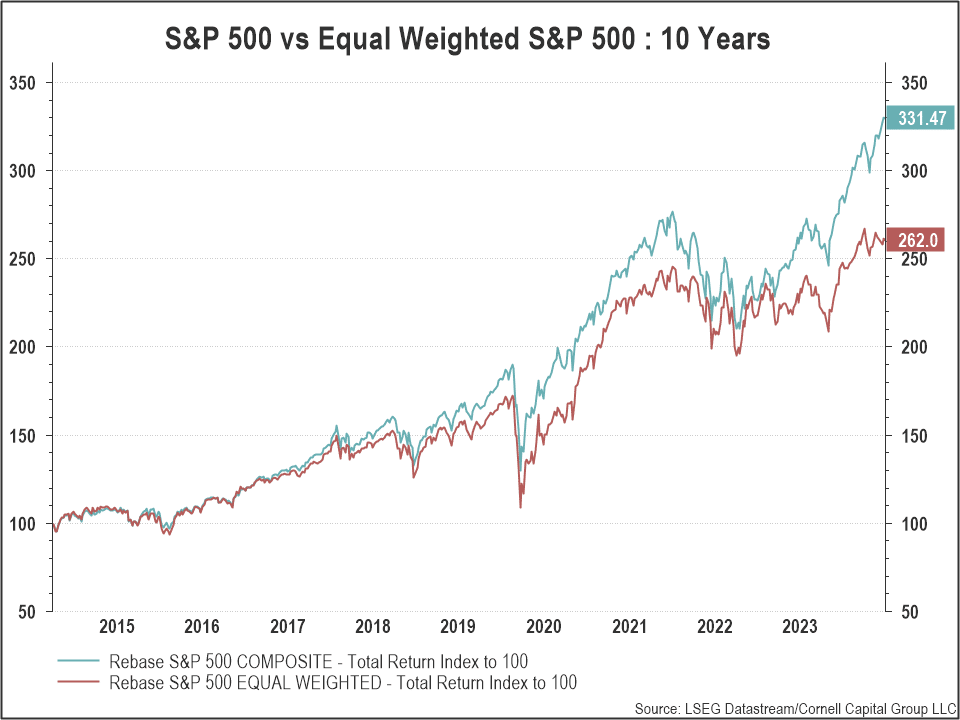
Then a gap appears and widens through the pandemic and the recovery in 2021. The gap closes when the market turns down in 2022, but then increases again to an unprecedented discrepancy as the standard S&P 500 rose to record levels driven by the Mag 7 and other large firms.
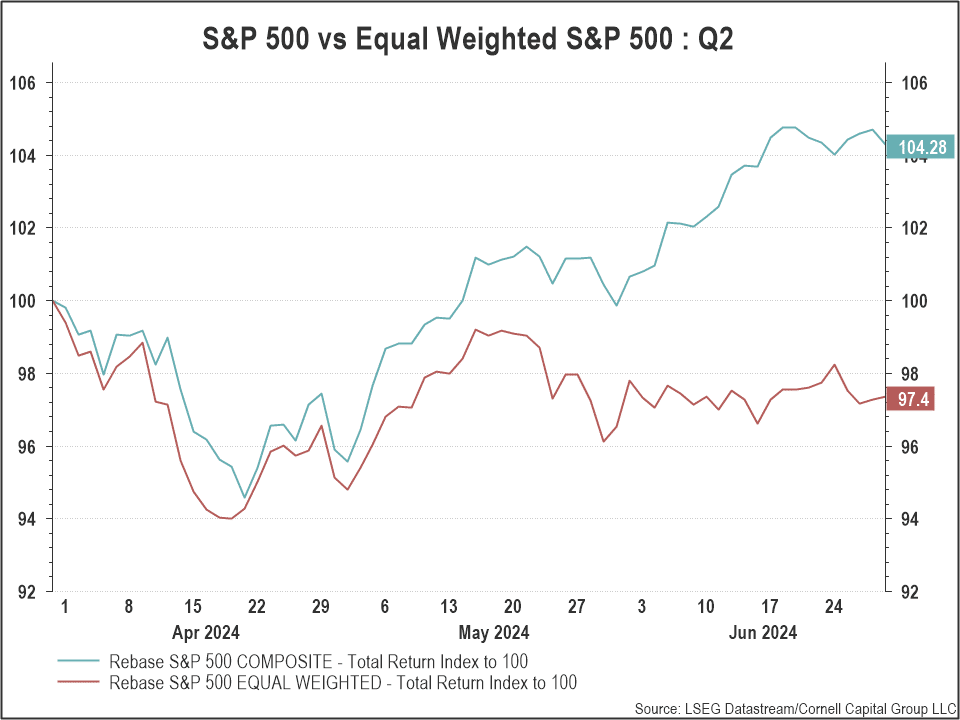
The widening gap was evident in Q2 2024 when the standard index rose 4.3% while the equal weighted index fell 2.6%.
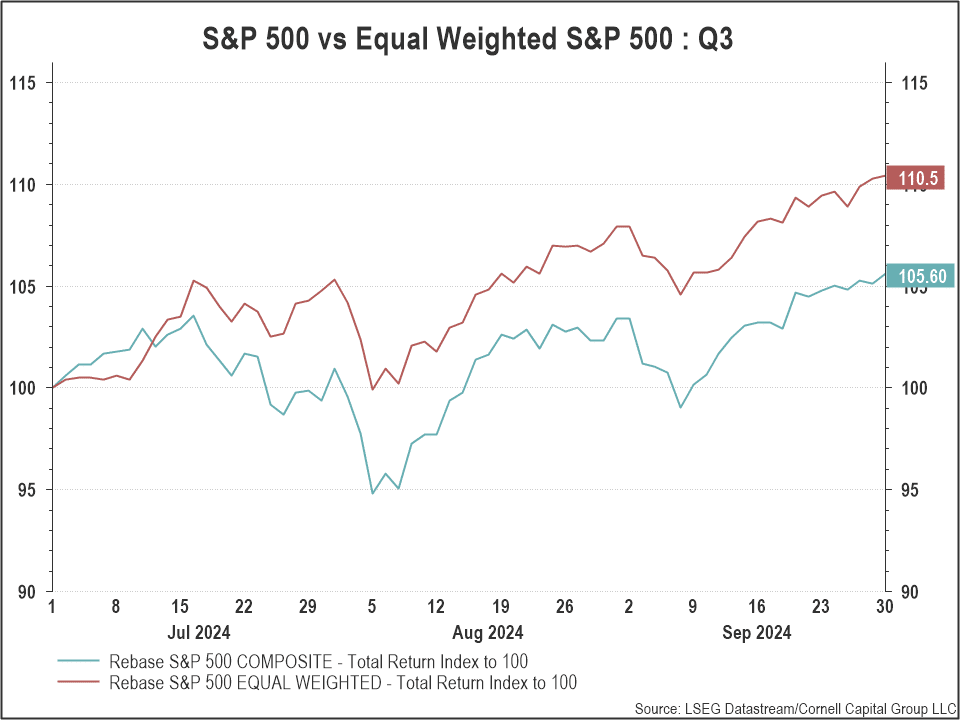
In Q3 2024 the market continued to increase, but it was no longer driven by the big tech companies. The equal weighted index jumped 10.5% compared to an increase of 5.6% in the standard S&P 500 as shown in the chart below. This raises two interesting questions. First, have the valuations of the big tech stocks been stretched to the point where they can no longer lead the market up? Second, is it evidence that the market as a whole has reached a level at which continued advancement at anything like the past rate of increase is unlikely?
Corporate Earnings and Earnings Multiples
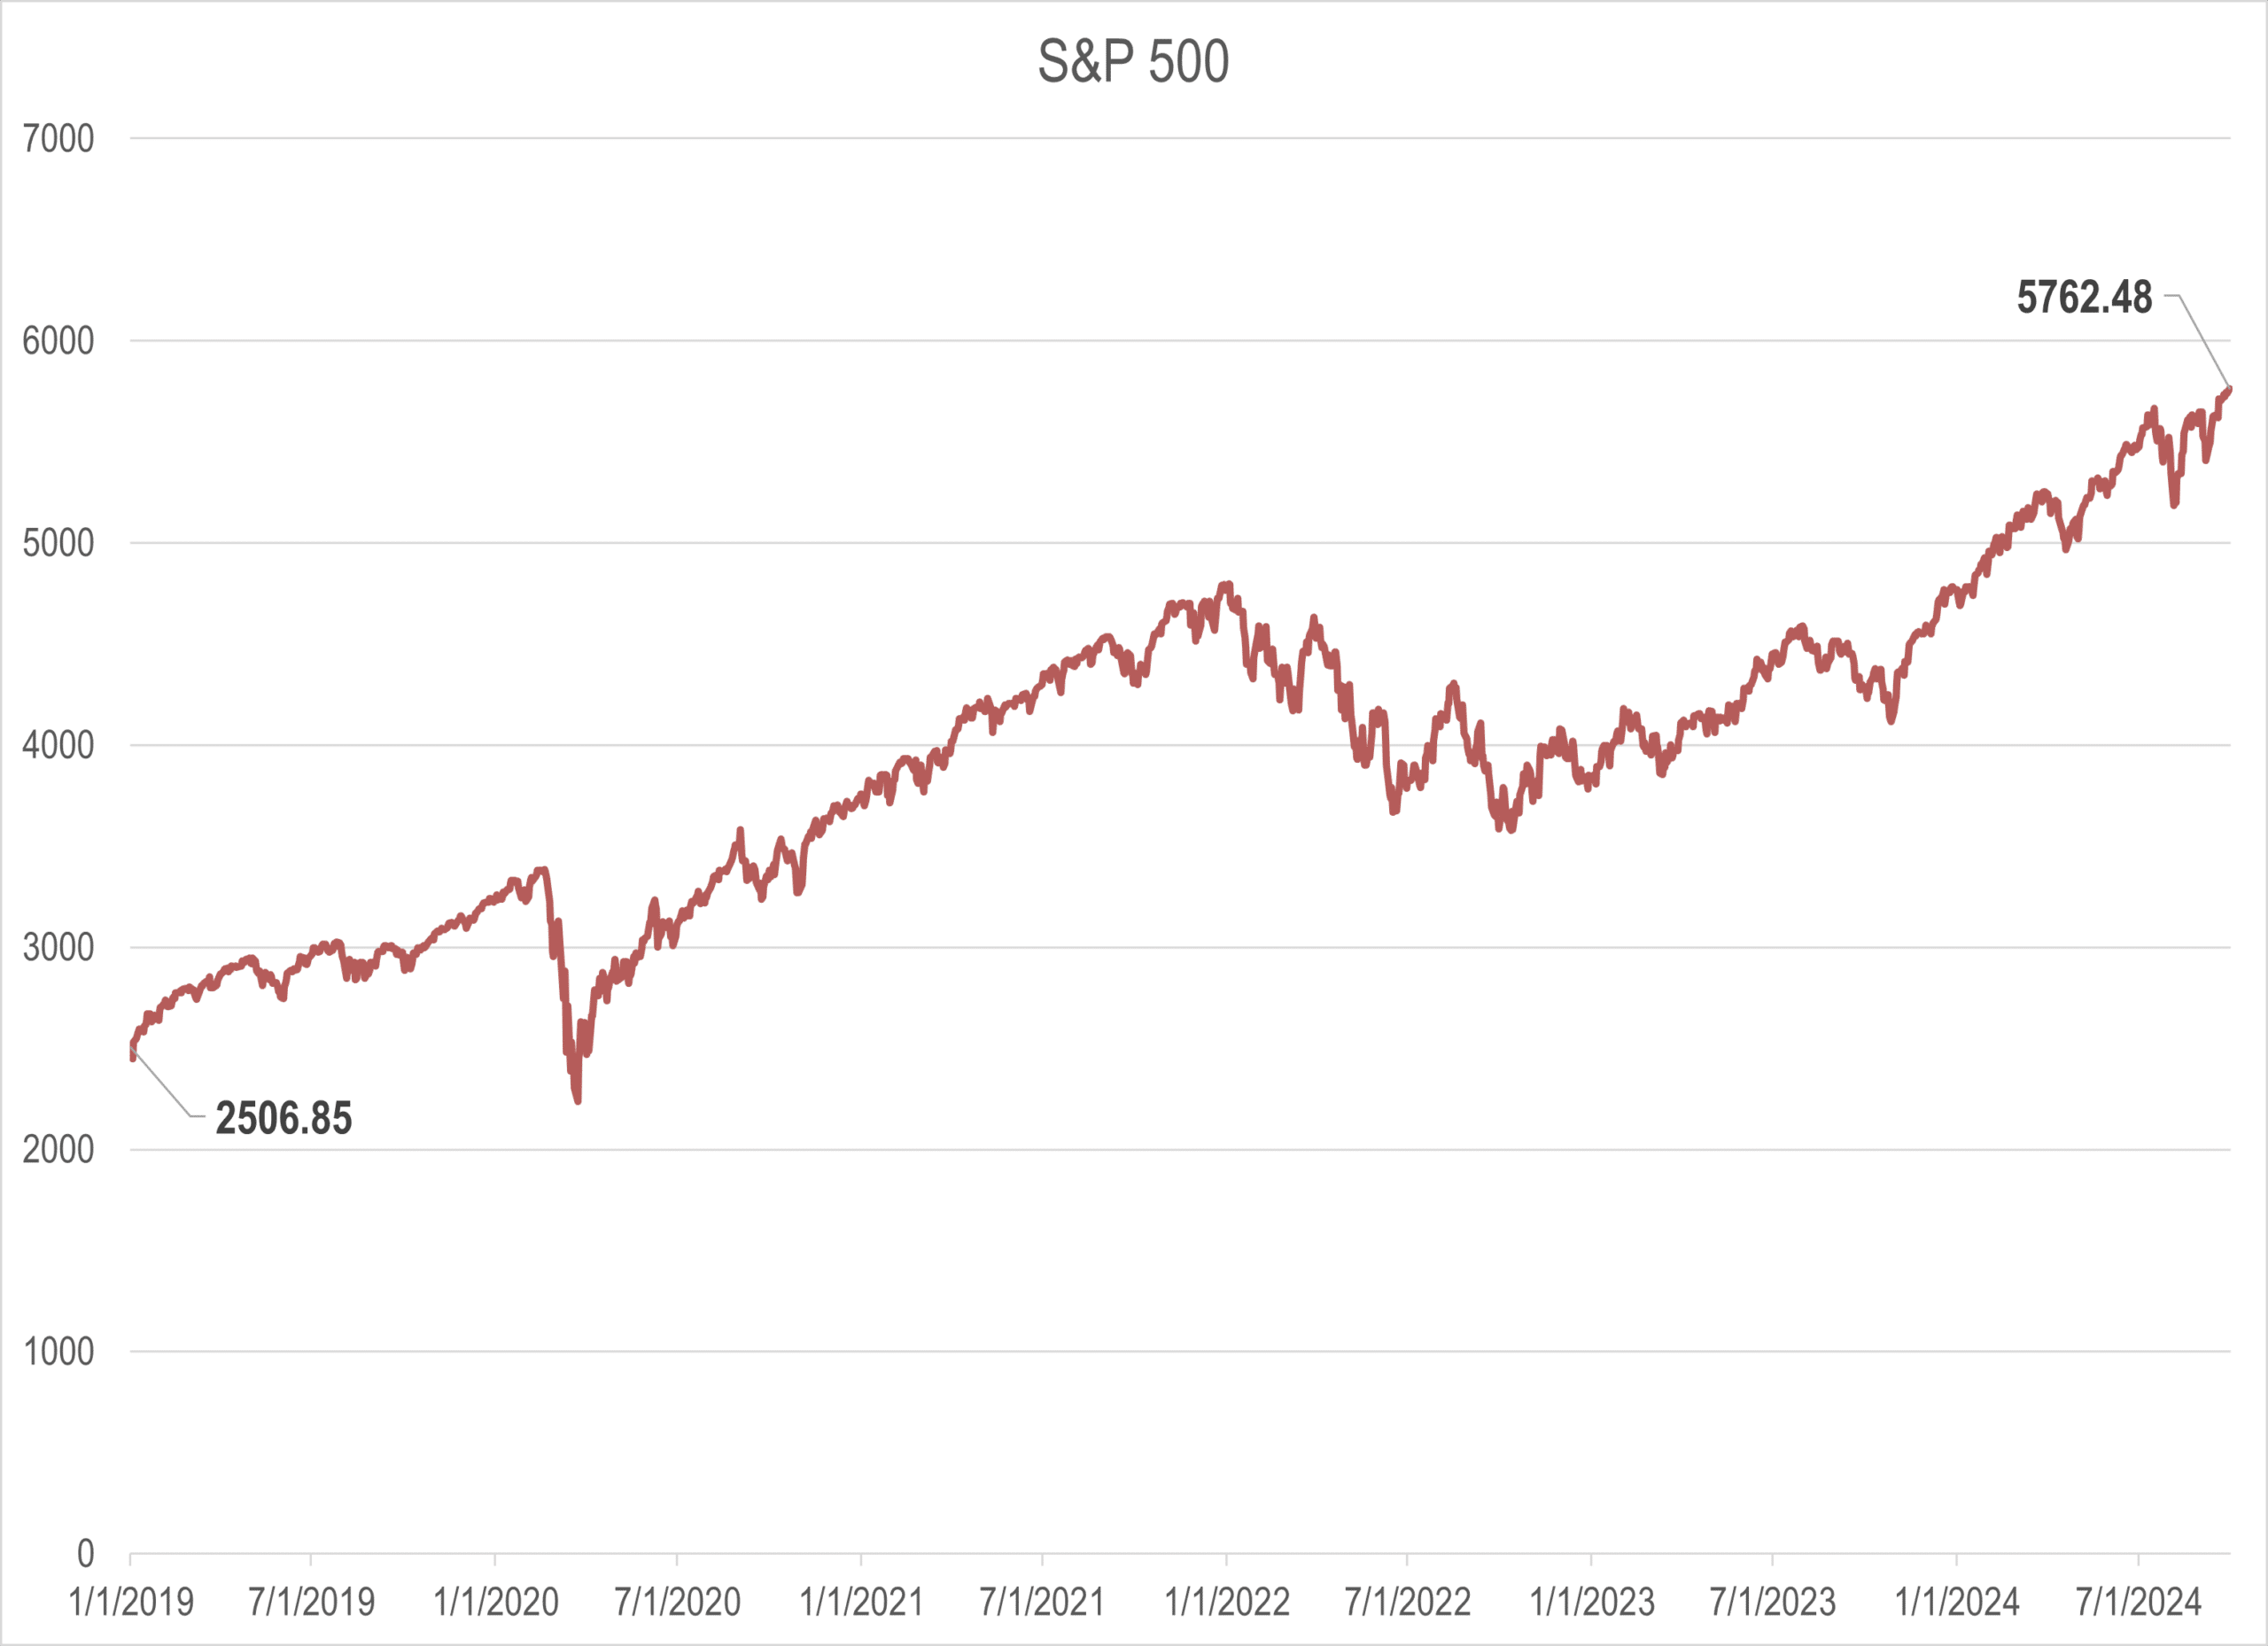
Basic math implies that any movement in market indexes like the S&P 500 must be due to either changes in corporate earnings or changes in the price investors are willing to pay for a dollar of earnings – the P/E multiple. To see what this basic identity implies, we recently analyzed the behavior of the market between January 1, 2019, and the end of Q3.
As shown in the chart below, on January 1, 2019, the S&P 500 index stood at 2506. By the market close on September 30, 2024, the index had risen to 5762, an increase of 130% representing a compound growth rate of 15.6% per year.
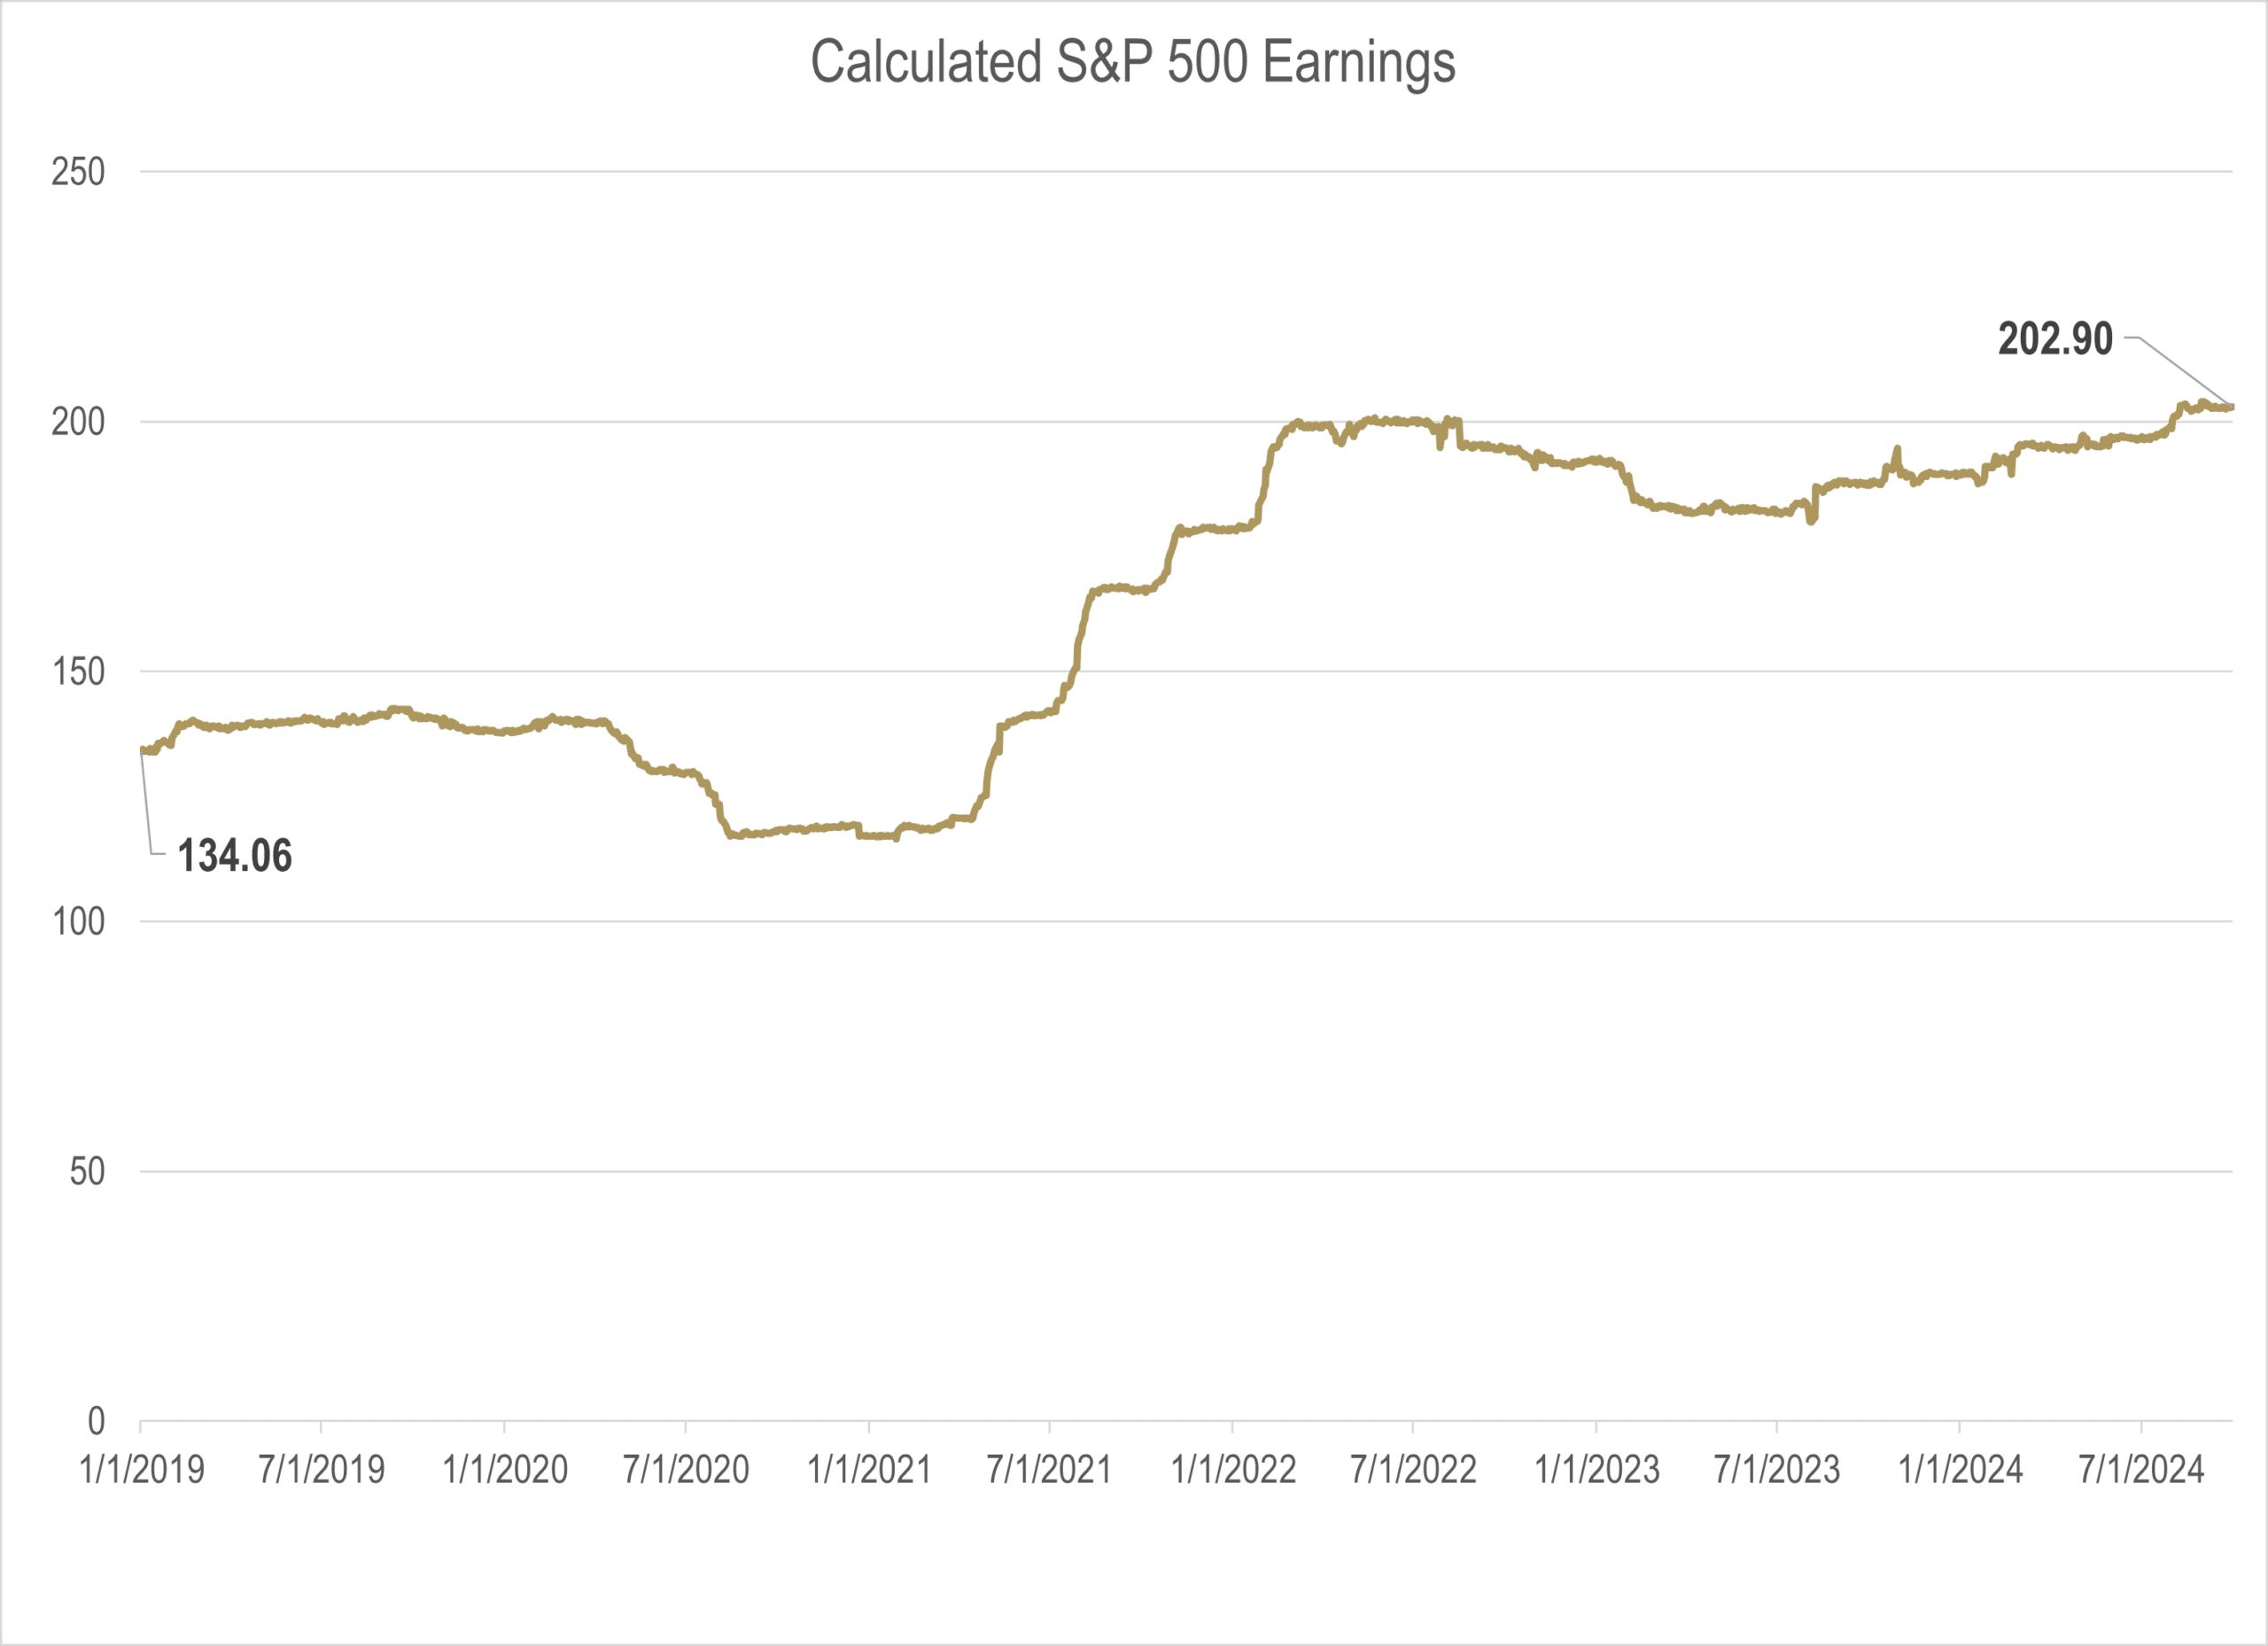
The next chart shows that over the same period, earnings rose from 134 to 202, an increase of 51%, an annualized compound growth rate of 7.5%.
The third chart plots the P/E ratio. Over the period, it rose from 18.2 to 28.4, an increase of 52%, an annualized compound growth rate of 7.5%.
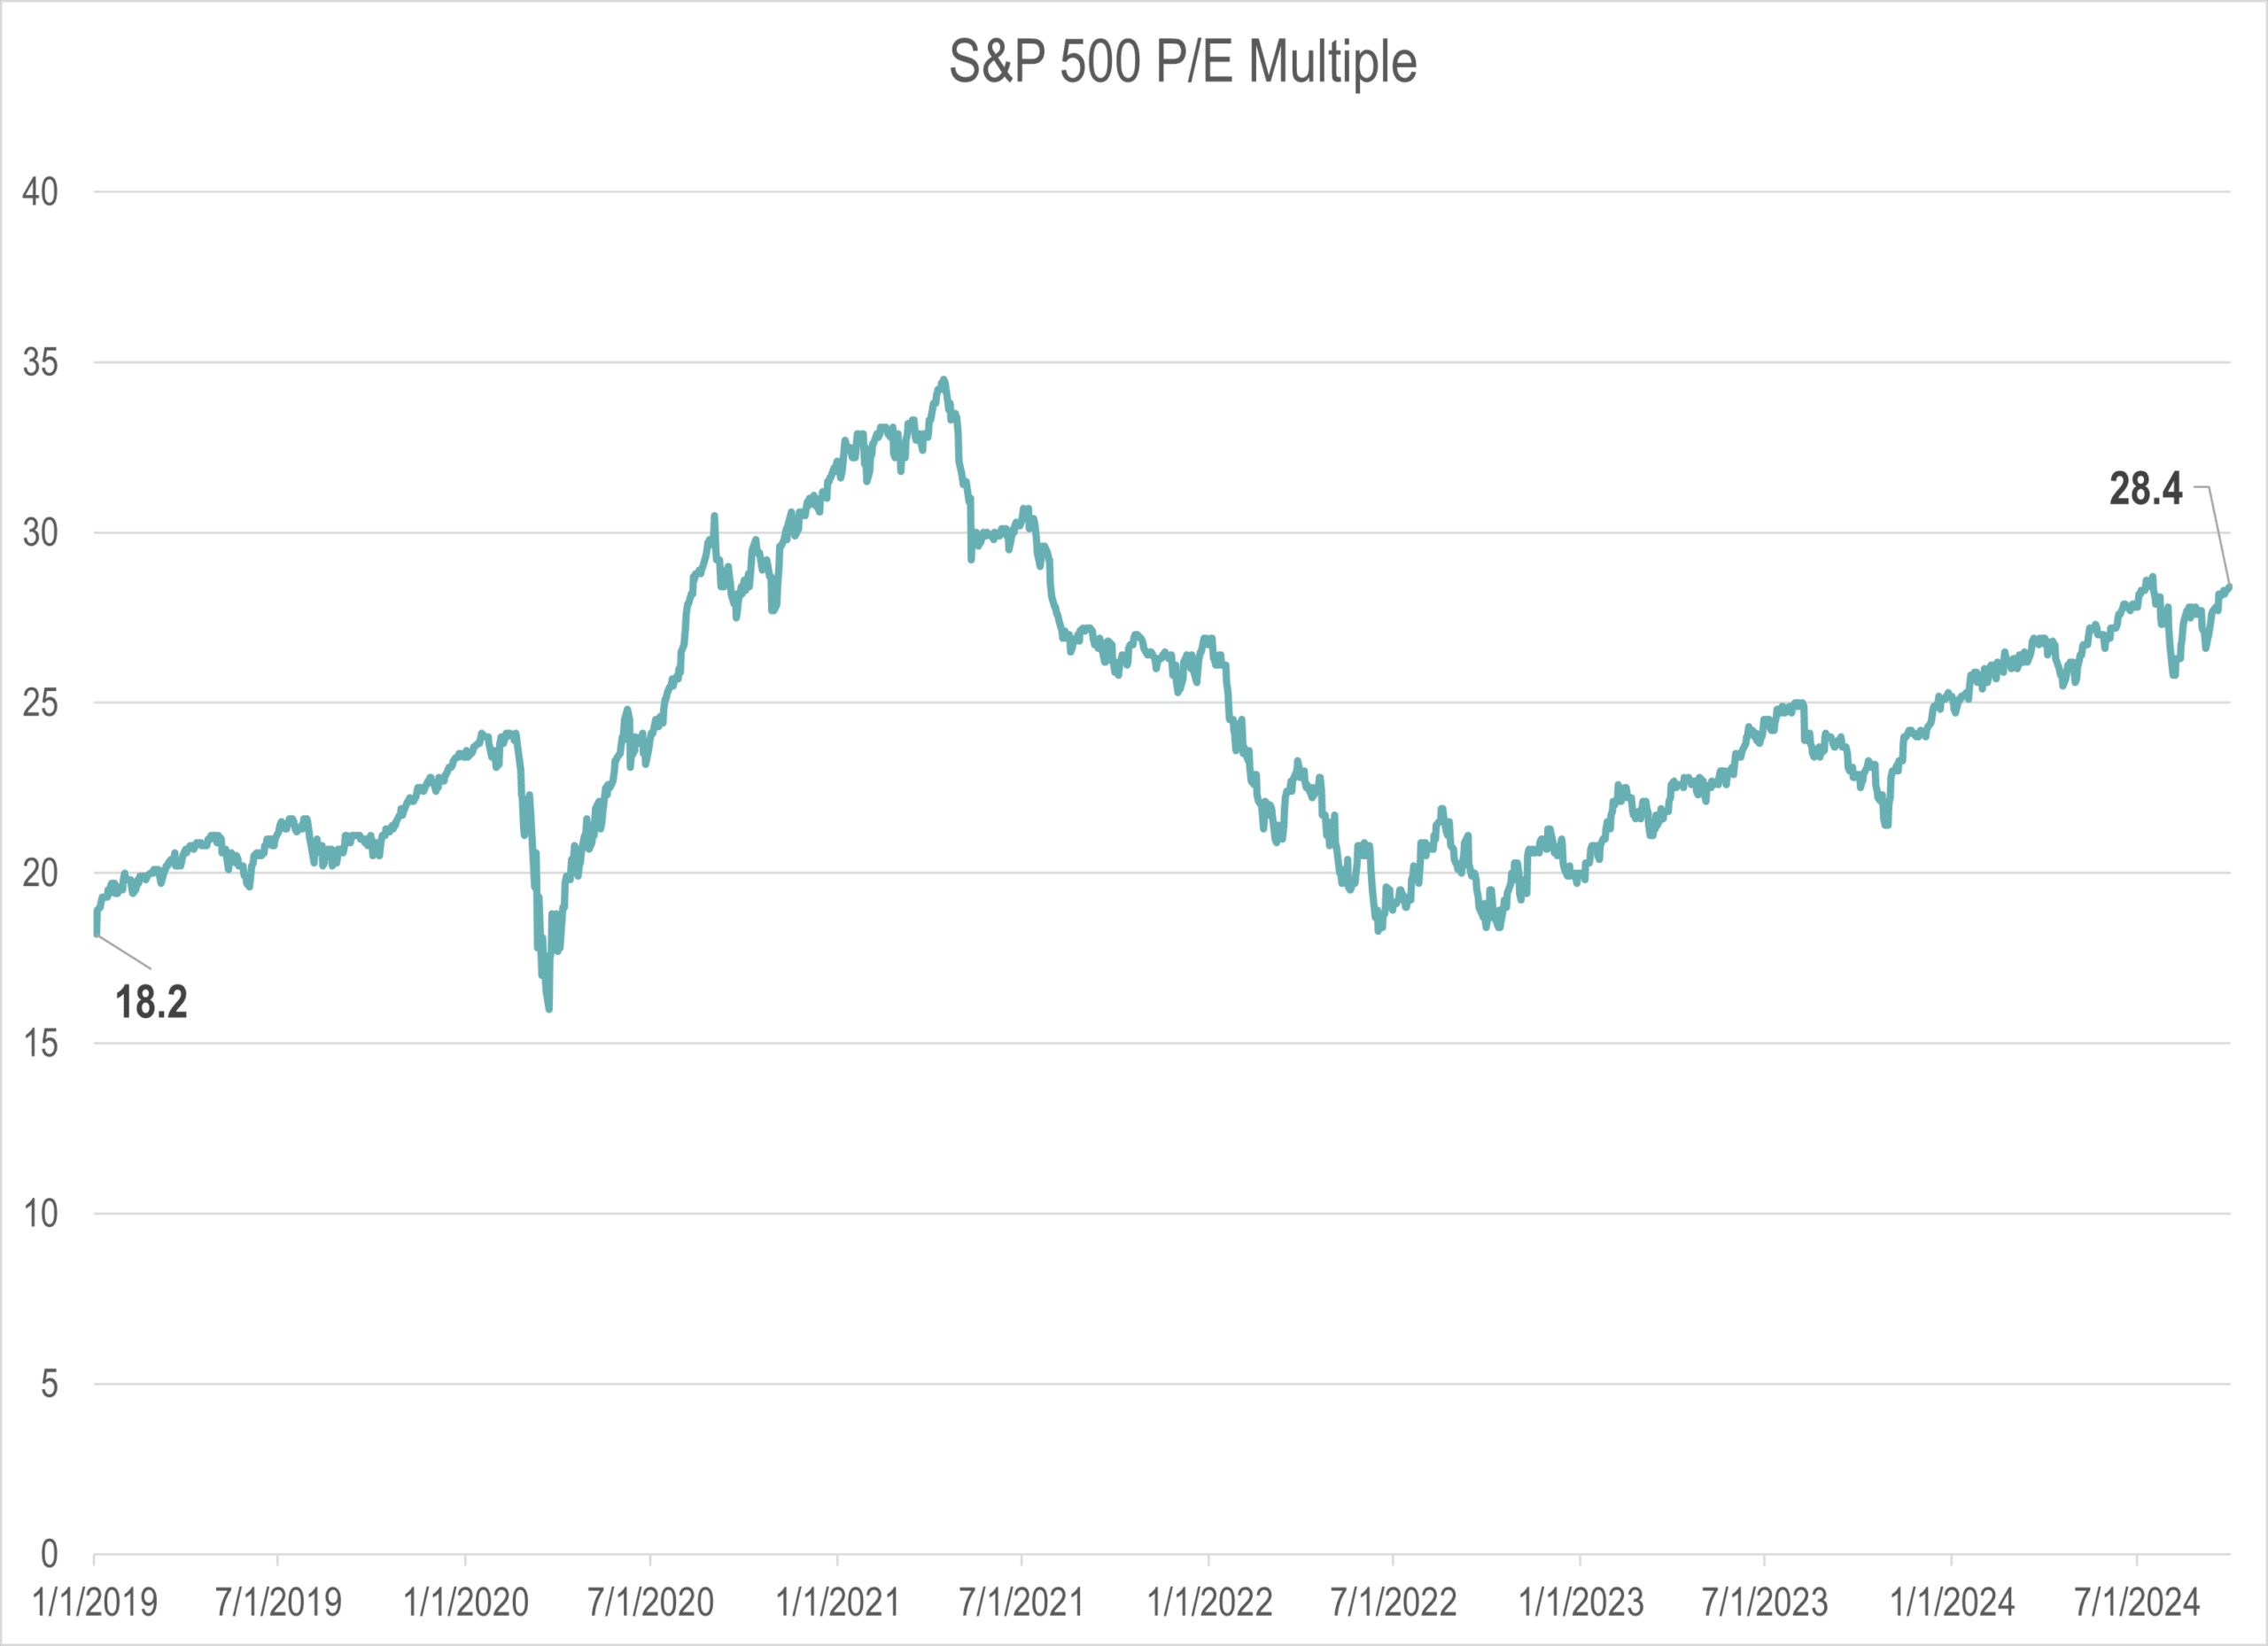
Taken together the charts show that about half the increase in the S&P 500 index was due to the growth in earnings and the other half was due to expansion of the price/earnings multiple. The key question going forward is whether future increases in earnings or multiples can lead to growth in the index comparable to that experienced during the past 5.75 years. In two recent Reflections on Investing, we concluded that such growth was unlikely.
In the case of earnings, the first of two Reflections on Investing argued that their exceptional growth during the period had been largely due to a combination of extraordinarily low interest rates and low taxes. Going forward, a return to near zero interest rates does not seem possible. Meanwhile, corporate taxes are likely to rise as the government attempts to find new revenue to cope with record debt and deficits. In summary, future earnings growth will be markedly slower than in the past 5.75 years.
Turing to the multiple, it equals the amount that investors are willing to pay for a dollar of earnings. That in turn reflects their sentiment regarding future earnings. When investors are more optimistic about future earnings and less concerned about risk, they will pay more for a dollar of current earnings. The runup in the P/E ratio is evidence of investor optimism and lower risk aversion. In our latest Reflections on Investing we argued that continuing increases in the multiple similar to those of the last 5.75 years is doubtful. From current levels, reflecting high optimism and low risk aversion, a regression back toward the mean is more likely than a continuation of past trends. If that occurs the multiple will contract, negatively affecting stock prices.
Putting the pieces together our analysis implies a much lower rate of appreciation in the S&P 500 going forward and a pullback cannot be ruled out.
Some claim that Fed rate cuts will spur the market forward. We think this effect is likely to be more muted than the media seems to believe. First, even with the cut, the overnight rate which the Fed sets is still far above the zero level of the recent past. Second, as Prof. Aswath Damodaran notes, the corporate interest costs are more closely related to rates on longer term bonds than the overnight rate. Following the cut, Damodaran observed that interest rates on longer term Treasury bonds actually rose.
Review of Recessionary Warnings
In our Q2 memo we noted that recession signals continued to flash. We focused on two indicators in particular, the slope of the yield curve and Sahm rule. We noted that “These indicators should be taken with a grain of salt. Perhaps this time will be different, and the economy will avoid a recession. But it would be foolhardy to ignore them entirely. They are yet another reason, along with stretched valuations, to follow a conservative, low-risk, investment strategy.”
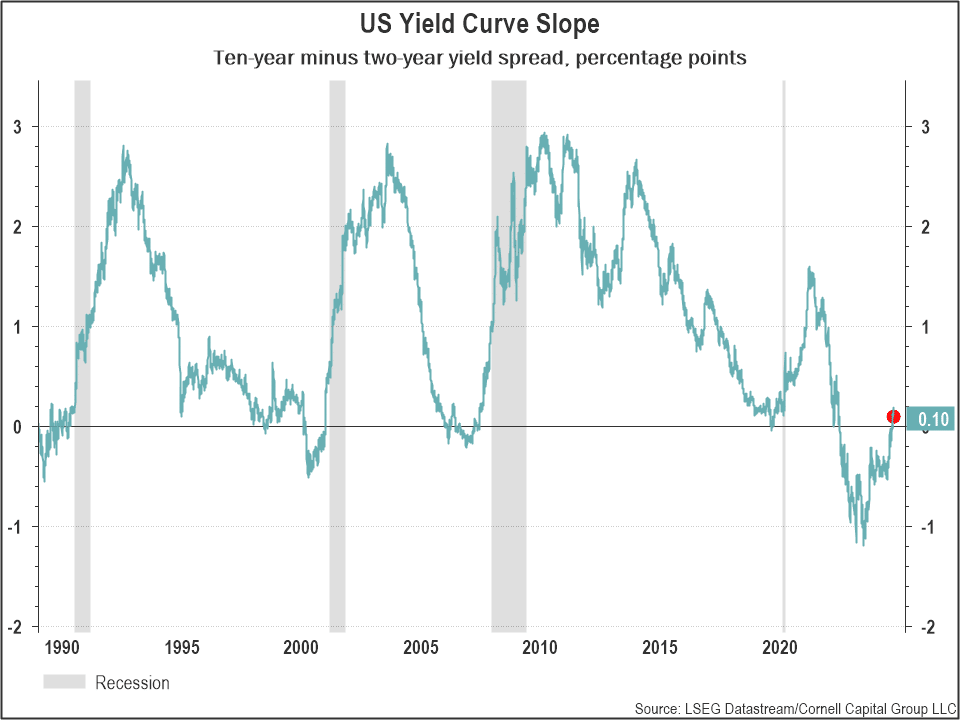
Updates of the indicators to include Q3 data still give us heart burn. While it is true that the yield curve has uninverted, that is exactly the situation in which recessions began in the past. It was only after the yield curve normalized following an inversion that economic activity slowed as shown in the updated chart below.
With respect to the Sahm Rule, it has now breached its recession indicator level of 0.50. In every other case in which this occurred the economy entered a recession.
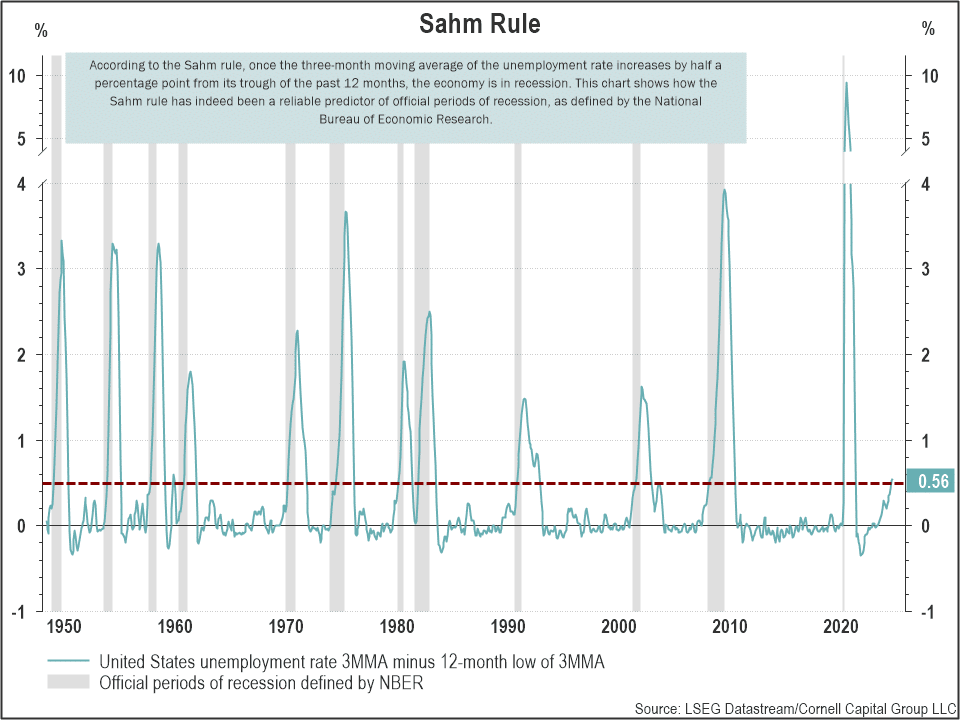
The bottom line for us is that these two recession indicators reinforce our cautious investment stance. If the economy were to enter a recession the result could be a sharp decline in stock prices. We think that at least a partial hedge against this eventuality is wise particularly in light of the stretched current valuations.
The Elephant in the Room: Government Fiscal Policy
We close with what we see as a critical issue for investors that is only beginning to get the attention it deserves. As the chart below shows, the total Federal debt has ballooned to $35 trillion. At that level, interest payments on the debt will exceed the entire defense budget. To make matters worse, the country is running current deficits at levels never before seen during peace time with a strong economy. The projected deficit for 2024 is on the order of $2 trillion. In our view, this is an unsustainable situation.
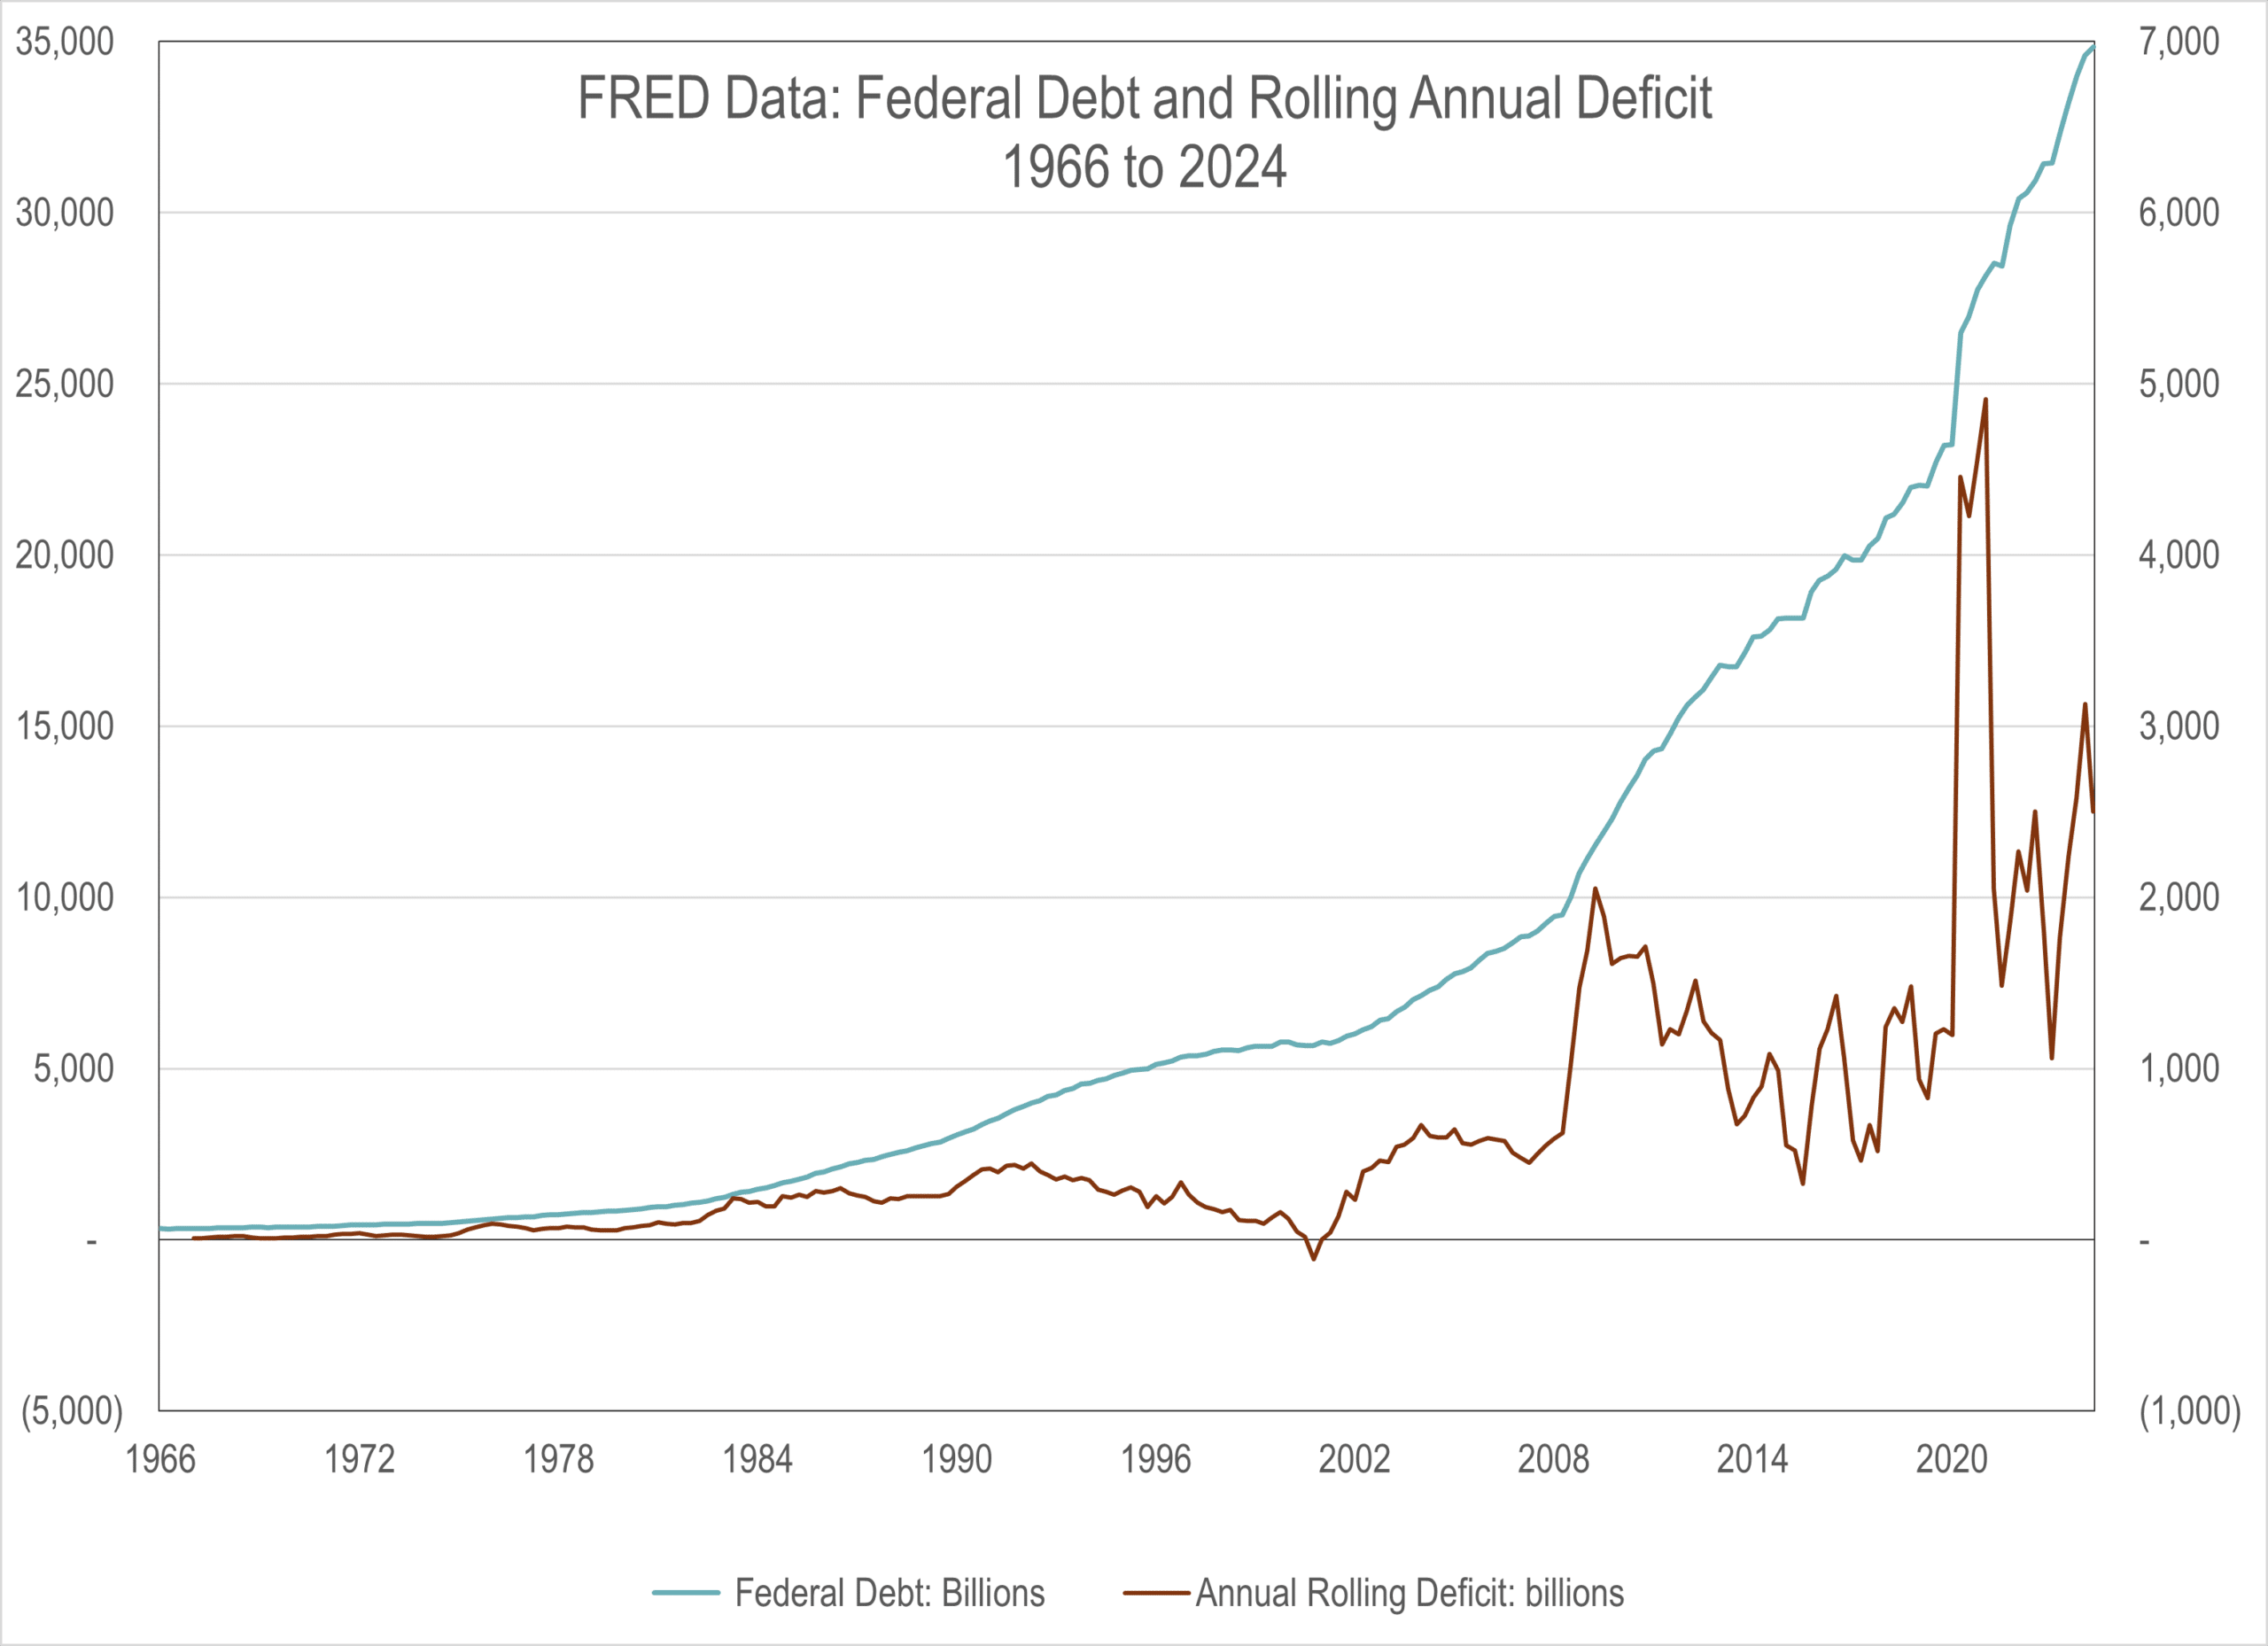
Americans have become too used to government services that they do not pay for with taxes. The key questions are how and when the situation will be resolved and how will the resolution impact investors? Suggestions such as taxing unrealized capital gains and even a wealth tax have been floated. While such suggestions are unlikely to become law, it illustrates the possible investor impact of a government financial crisis. At CCG this is an issue we are monitoring closely. It is the elephant in the room.
This memorandum is being made available for educational purposes only and should not be used for any other purpose. The information contained herein does not constitute and should not be construed as an offering of advisory services or an offer to sell or solicitation to buy any securities or related financial instruments in any jurisdiction.


